Slow servers cost money and users. A 100-millisecond delay can reduce conversions by 7%, and over half of mobile users abandon sites that take more than 3 seconds to load. Monitoring cloud server response times is critical to avoid these risks and keep performance steady.
Here are 10 tools to monitor and optimize your cloud server response times effectively:
- Datadog: Real-time distributed tracing and anomaly detection.
- New Relic: AI-powered automation and security features.
- Dynatrace: Auto-discovery and AI-based root cause analysis.
- SolarWinds: Customizable alerts and monitoring templates.
- ManageEngine OpManager: Affordable, scalable monitoring starting at $245.
- AWS CloudWatch: Native AWS integration and custom metric support.
- Google Cloud Operations: Transparent pricing for logging, monitoring, and tracing.
- Microsoft Azure Monitor: Comprehensive Azure infrastructure visibility.
- EMCO Ping Monitor: Free for small setups, enterprise-ready for large deployments.
- Site24x7: Flexible pricing for cloud, server, and application monitoring.
Key Metrics to Watch:
- Region-Based Response Times: Hosting servers closer to users reduces latency.
- Auto-Scaling Response: Dynamic scaling keeps response times under 200ms.
- Serverless Cold Starts: Caching and memory tuning reduce delays.
Quick Comparison
| Tool | Key Feature | Starting Price |
|---|---|---|
| Datadog | Real-time tracing, anomaly detection | Custom pricing |
| New Relic | AI automation, security enhancements | Custom pricing |
| Dynatrace | AI-powered root cause analysis | Custom pricing |
| SolarWinds | Custom alerts, templates | Custom pricing |
| ManageEngine | Scalable, affordable monitoring | $245 for 10 devices |
| AWS CloudWatch | AWS-native integration | Custom pricing |
| Google Cloud Ops | Combined logging, monitoring, tracing | $0.20–$0.50/unit |
| Microsoft Azure | Full Azure infrastructure visibility | Custom pricing |
| EMCO Ping Monitor | Free for 5 hosts, scalable options | $199+ |
| Site24x7 | Flexible pricing for various resources | $1+/resource/month |
Actionable Tip: Start with basic tools to monitor uptime and response times. Gradually add advanced features like anomaly detection and auto-scaling metrics to optimize performance and reduce costs.
10 Cloud Server Response Time Monitoring Tools
Monitoring cloud server response times is critical for maintaining performance and ensuring smooth operations in today’s complex cloud environments. Here’s a breakdown of ten tools that excel in this area, each bringing unique features to the table.
1. Datadog Cloud Monitoring
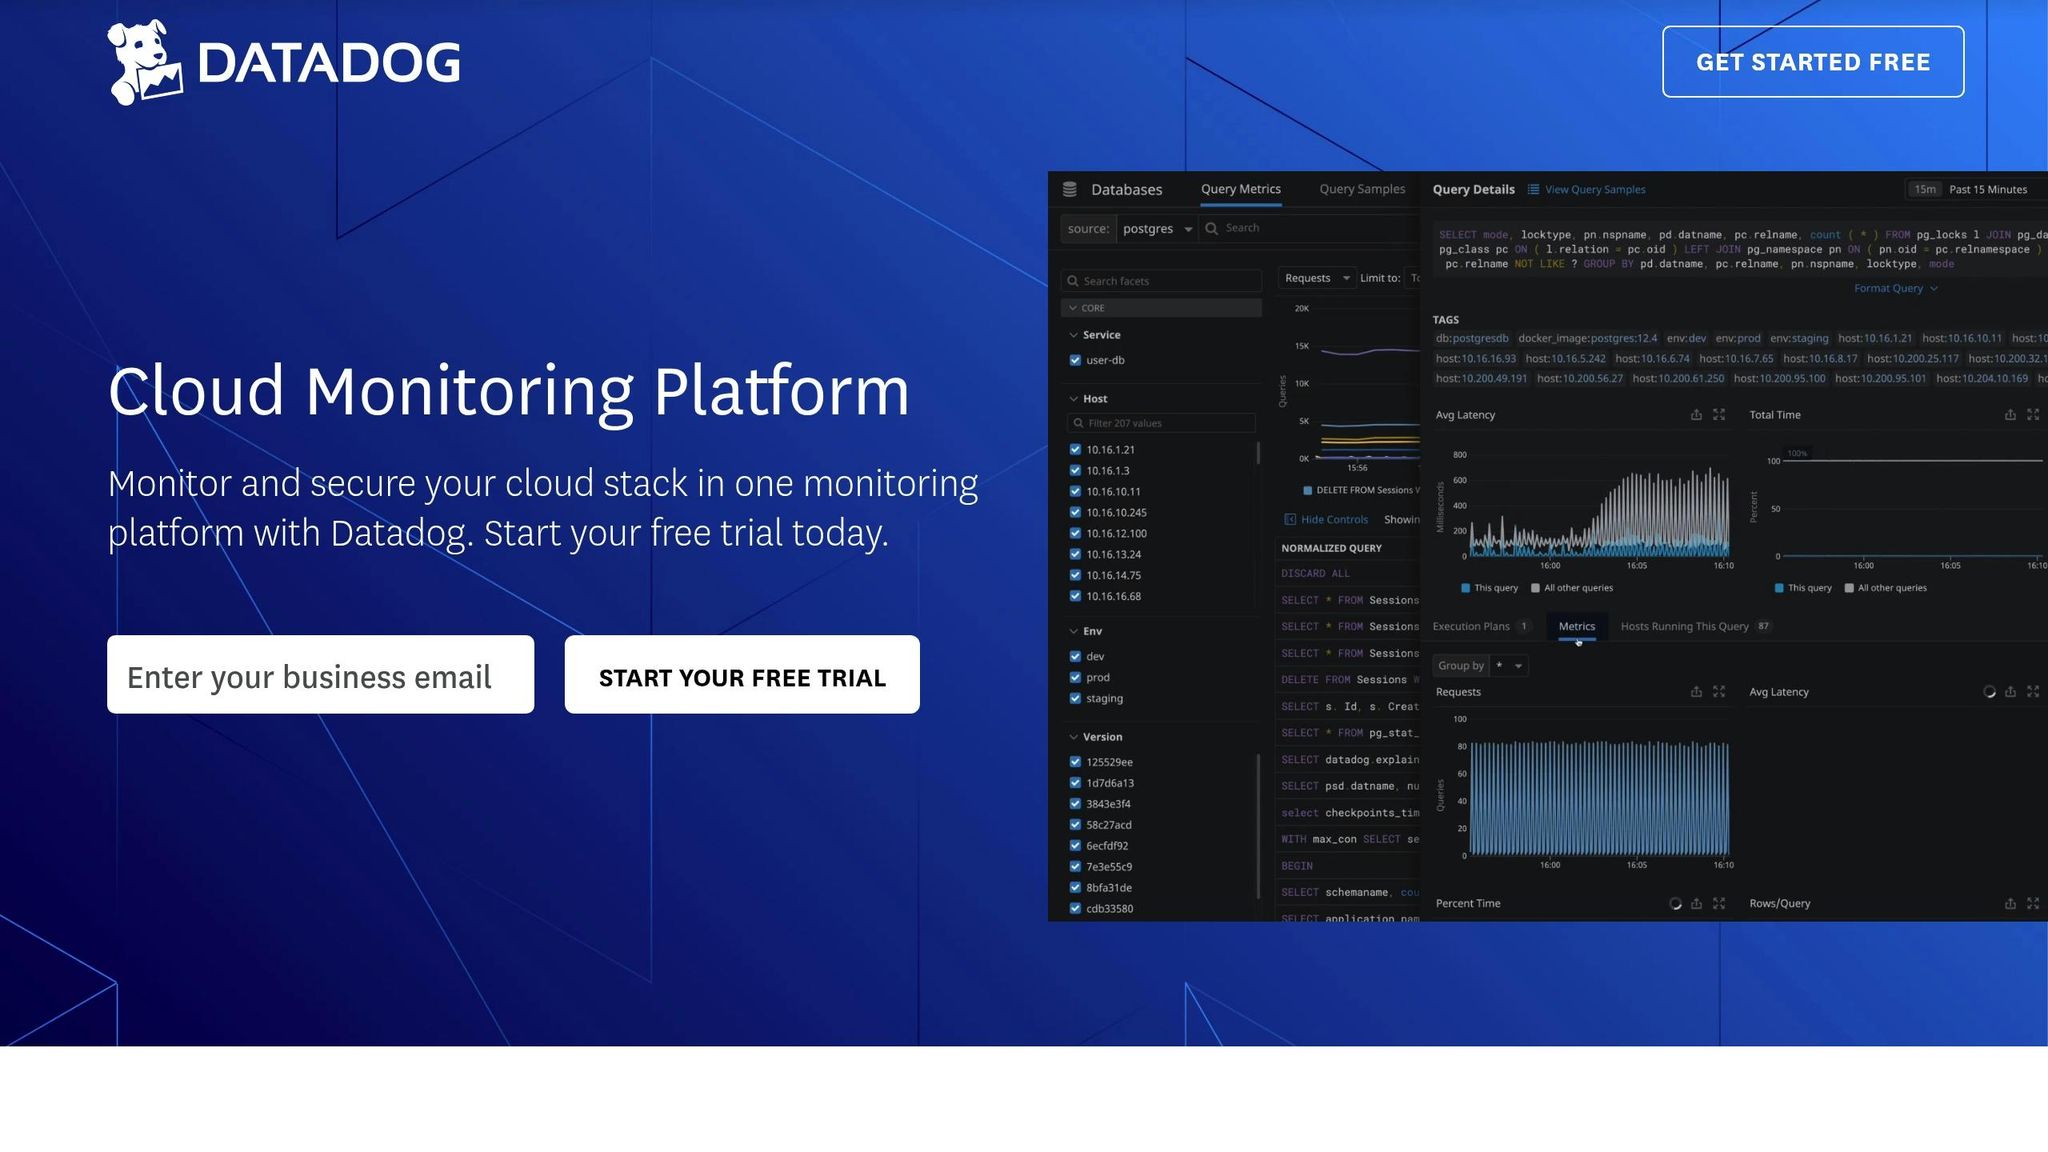
Datadog connects infrastructure metrics with application performance data using real-time distributed tracing. Its advanced anomaly detection helps pinpoint performance issues before they escalate.
2. New Relic Cloud Observability
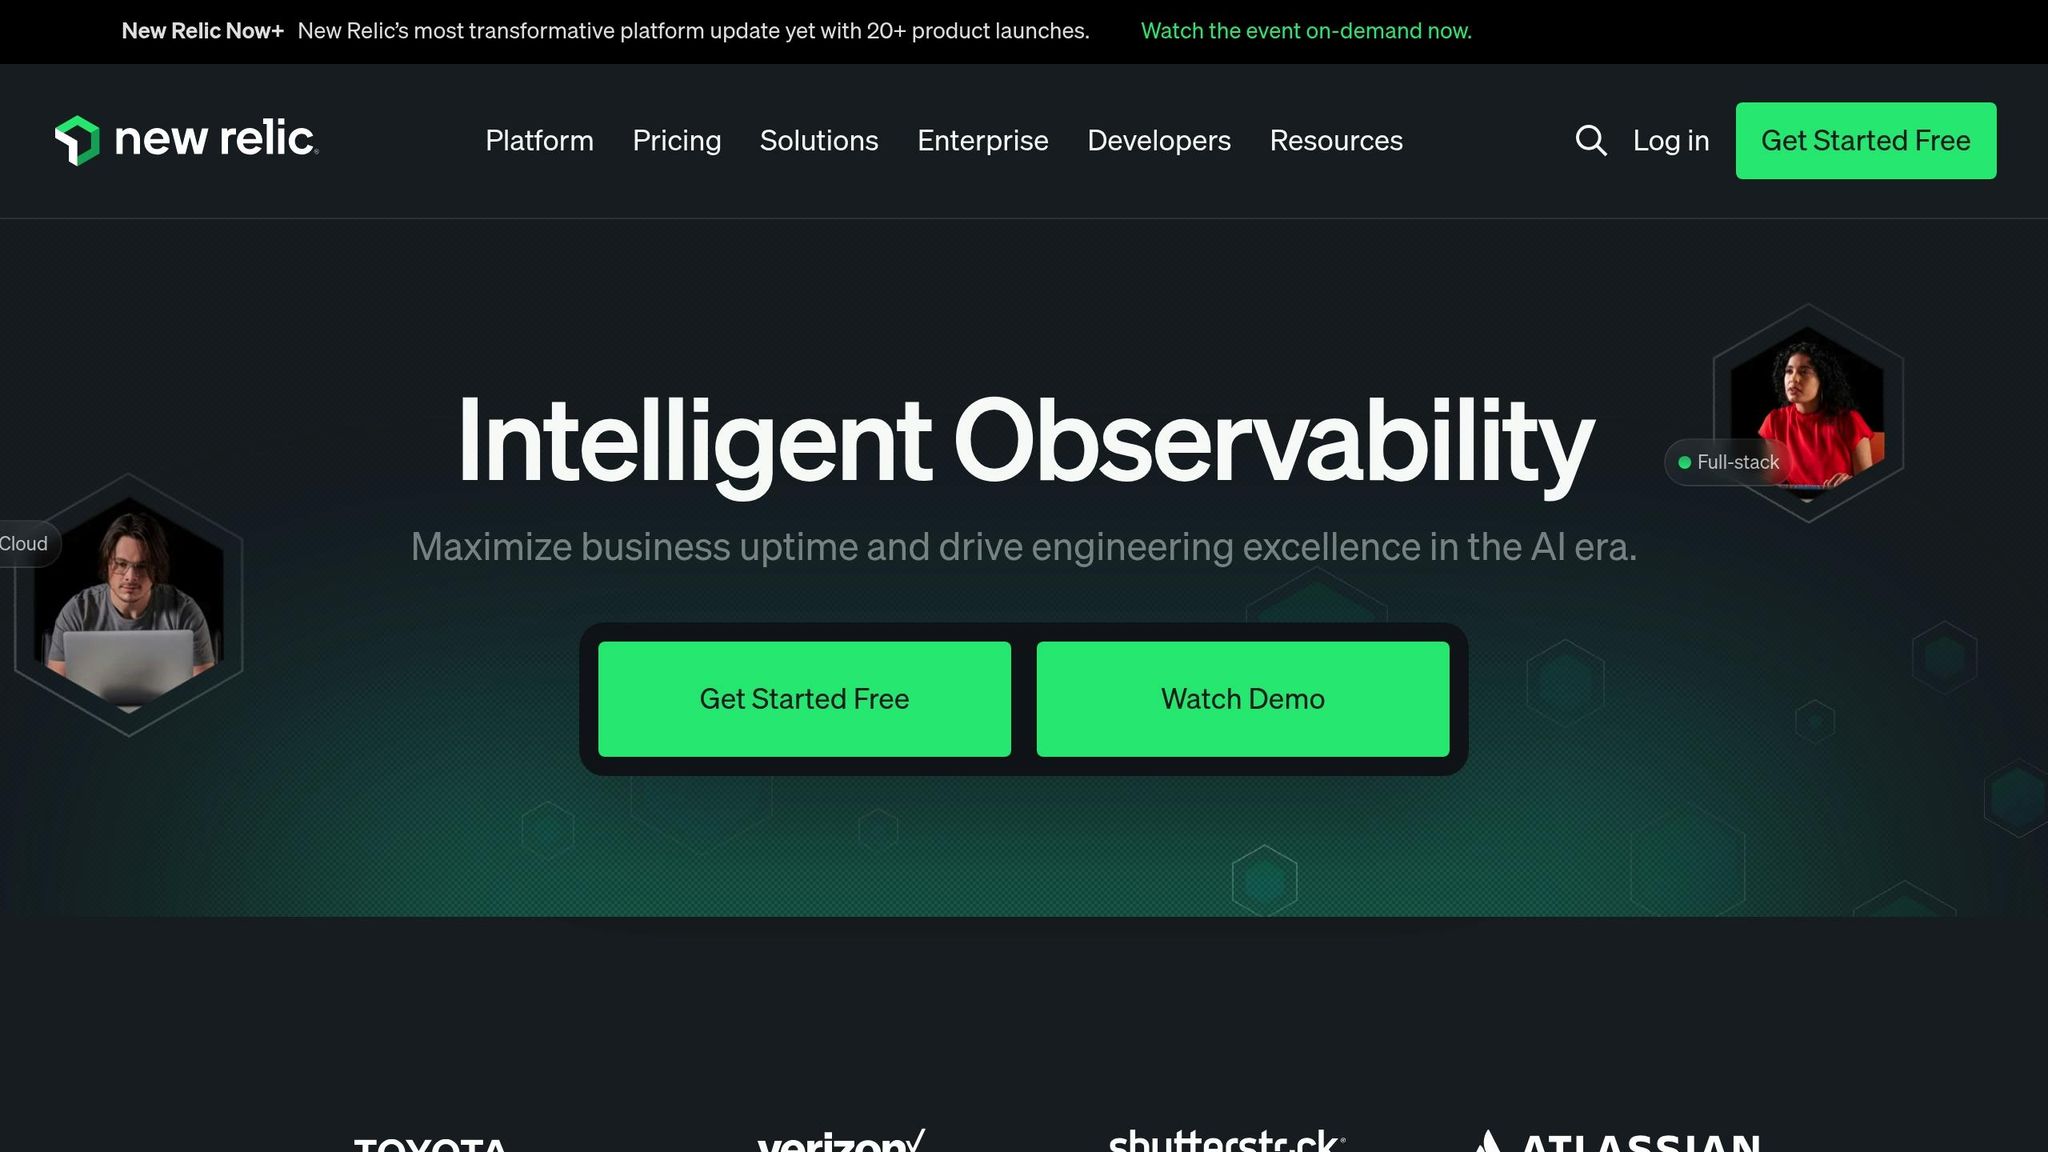
New Relic’s Transaction 360 feature can cut resolution times significantly - up to five times faster. With AI-powered integrations like ServiceNow and Gemini Code Assist, it automates tasks and improves efficiency. Its Security RX feature enhances system security by reducing vulnerabilities by up to 97% through runtime verification.
3. Dynatrace Cloud Infrastructure Monitoring
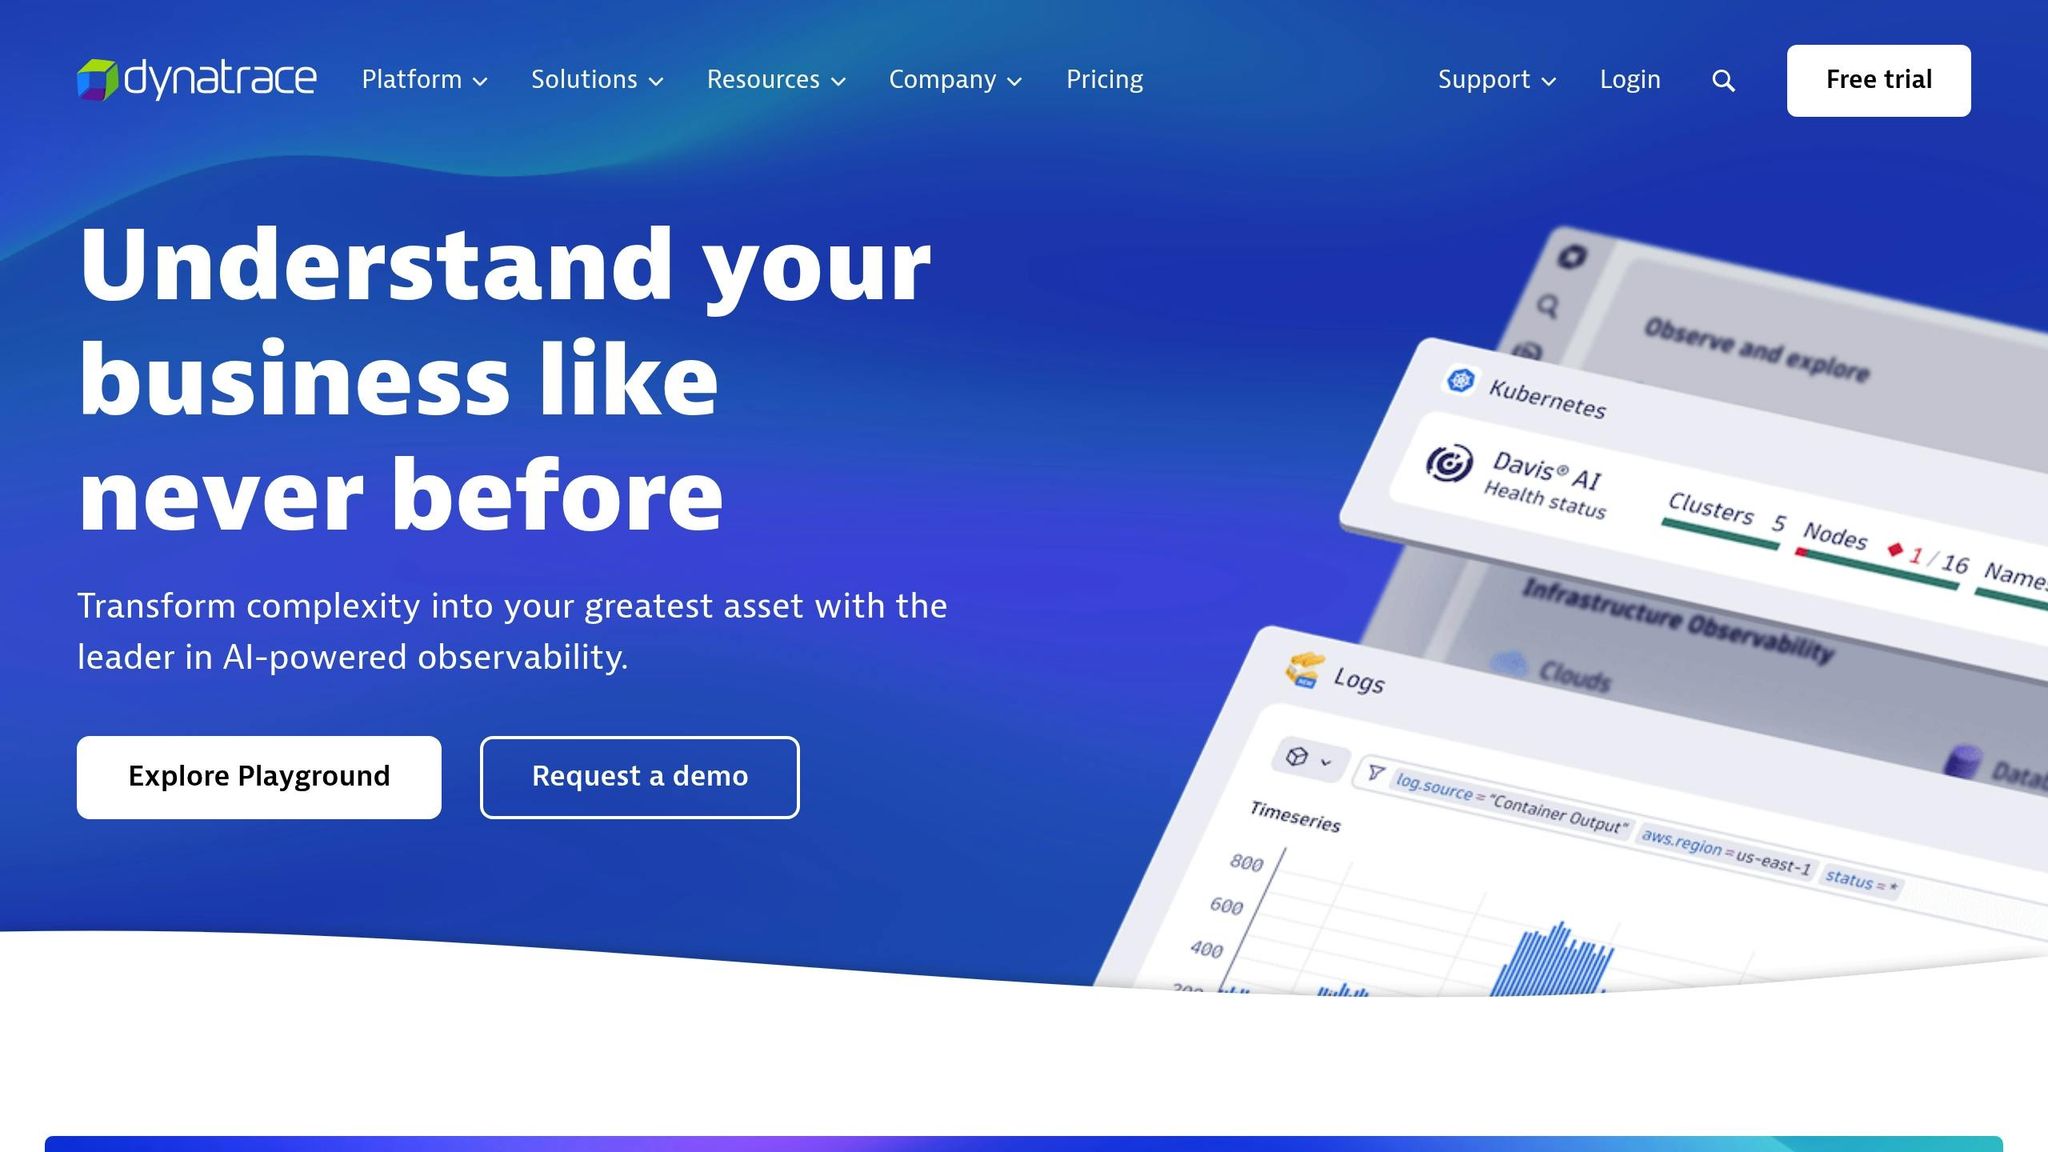
Dynatrace simplifies monitoring in complex environments with auto-discovery and AI-powered root cause analysis, making it easier to resolve issues quickly.
4. SolarWinds Server & Application Monitor
SolarWinds provides in-depth metrics and customizable alerts. Its monitoring templates make setup and deployment straightforward, saving time and effort.
5. ManageEngine OpManager
Starting at $245 for monitoring 10 devices, ManageEngine OpManager offers scalable solutions with Professional and Enterprise editions available for larger networks.
6. AWS CloudWatch
AWS CloudWatch seamlessly integrates with AWS services like CloudTrail. It supports both native AWS resource monitoring and custom metrics, making it a versatile choice for AWS users.
7. Google Cloud Operations
Google Cloud Operations offers combined logging, monitoring, and tracing features with transparent pricing:
- Cloud Logging: $0.50 per GiB
- Cloud Monitoring: $0.2580 per MiB (for 150–100,000 MiB)
- Cloud Trace: $0.20 per million spans
8. Microsoft Azure Monitor
Azure Monitor delivers comprehensive visibility into Azure infrastructures, combining application insights with latency detection to ensure reliable performance.
9. EMCO Ping Monitor
EMCO Ping Monitor can handle setups ranging from small-scale (free for up to 5 hosts) to enterprise-level deployments supporting over 8,000 hosts. The Professional edition starts at $199.
10. Site24x7 Cloud Monitoring
Site24x7 offers flexible pricing options based on your monitoring needs:
- Cloud Monitoring: From $1 per resource/month
- Server Monitoring: From $2.50 per VM/month
- Application Performance Monitoring: From $8 per instance/month
- Real User Monitoring: From $5 per 100K pageviews/month
Main Cloud Server Monitoring Metrics
Keeping an eye on key server response metrics is critical for ensuring your cloud systems perform at their best.
Region-Based Response Times
Where your users are located plays a big role in how quickly your servers respond. Physical distance introduces latency, which can directly affect user experience. For example, websites that load in under 1 second see nearly three times the conversion rates compared to those that take 5 seconds to load.
Here’s how you can improve performance in different regions:
| Region | Recommended Action | Expected Impact |
|---|---|---|
| Primary Markets | Host servers in local data centers | Noticeably faster response times |
| Secondary Markets | Use CDN edge locations | Delivery speed can improve by up to 60% |
| Global Audience | Deploy servers across multiple regions | Lower latency for users worldwide |
Auto-Scaling Response Monitoring
A properly configured auto-scaling setup ensures response times stay under 200 milliseconds. Take this example: a popular e-commerce platform used auto-scaling policies triggered by CPU usage and user login activity. During high-traffic periods, the system automatically added resources whenever CPU usage surpassed 70%. This approach kept performance steady while managing costs.
Serverless Function Start-Up Times
Cold starts in serverless functions can be a major bottleneck. With AWS Lambda dominating 77% of the serverless market, it’s essential to keep start-up times in check. Key areas to monitor include initialization time, memory allocation, and concurrent executions. For instance, using effective caching strategies can cut server load by 75% and reduce response times by 50%. Google advises maintaining server response times of 200 milliseconds or less for web applications.
These metrics form the foundation for further optimization, including tools that support frontend development and enhance overall performance.
Frontend Performance Tools
While backend monitoring is crucial, frontend tools play a key role in uncovering client-side issues that can disrupt the user experience. Interestingly, around 80% of performance problems are tied to frontend components.
Hoverify Development Tools
Hoverify offers a set of tools designed to monitor and improve frontend performance in real time, making it easier to identify and resolve issues before they impact users.
| Feature | How It Helps Performance |
|---|---|
| Real-time Style Editor | Test and tweak CSS instantly, skipping the hassle of deployments. |
| Responsive Testing | Check performance on multiple devices at once to ensure consistency. |
| Asset Management | Spot oversized files that slow down page loading. |
| Tech Stack Analysis | Detect performance bottlenecks tied to specific frameworks. |
Considering that 47% of users expect a webpage to load in two seconds or less, Hoverify’s features - like real-time CSS testing, resource monitoring, and device simulations - make optimizing the frontend more efficient. It also includes SEO analysis and debugging tools to ensure a smooth experience for both users and search engines.
These insights align seamlessly with larger optimization efforts, especially in cloud-based environments.
Summary
Cloud monitoring tools play a key role in improving performance and managing costs in complex infrastructures. With cloud inefficiencies costing businesses up to $26 billion annually, the need for robust monitoring solutions is more pressing than ever.
The best cloud monitoring platforms excel in several critical areas:
| Capability | Business Impact |
|---|---|
| Real-time Monitoring | Pinpoints service bottlenecks instantly, minimizing downtime costs, which can hit $9,000 per minute. |
| Comprehensive Analytics | Provides insights by analyzing metrics, logs, and traces across the entire infrastructure stack. |
| Automated Alerts | Ensures rapid responses to performance issues before they escalate and affect users. |
| Resource Optimization | Cuts down on resource waste and enhances cost efficiency in cloud environments. |
These features highlight the wide-ranging functionality needed for effective cloud monitoring.
“Effective cloud APM is critical for delivering smooth digital experiences and driving business success”,
notes Sujatha R from DigitalOcean.
This insight resonates strongly when considering that nearly 70% of companies face challenges with cloud misconfigurations.
Hoverify complements backend tools by addressing frontend performance issues, creating a well-rounded strategy. Starting with basic uptime monitoring and gradually incorporating advanced metrics is a smart approach. Clear alert rules and status pages help maintain reliability and control expenses. Experts suggest that simpler, focused tools often deliver better reliability than overly complex systems.
FAQs
What’s the best way to choose a cloud server monitoring tool for my business?
To find the best cloud server monitoring tool for your business, start by pinpointing your specific requirements. Think about the cloud platform you rely on - whether it’s AWS, Azure, or Google Cloud - and the critical metrics you need to monitor, like response time, CPU usage, or network traffic. Ensure the tool aligns with your infrastructure and provides coverage across your entire stack, from servers to applications and databases.
Key features to prioritize include real-time alerts, a user-friendly interface, and smooth integration with your current tools. The right monitoring solution should simplify the process of spotting and fixing performance issues, helping your team stay efficient and reduce downtime.
What are the cost considerations of using features like anomaly detection and auto-scaling in cloud monitoring tools?
Advanced tools like anomaly detection can play a big role in keeping cloud costs in check. By spotting unusual spending patterns early, you can avoid budget overruns and potentially cut cloud expenses by 20% to 40%. That said, these tools often come with extra fees, especially if they rely on data processing or machine learning technologies, so it’s worth checking your provider’s pricing details.
Another smart feature is auto-scaling, which adjusts resources automatically based on demand. This helps eliminate waste from over-provisioning and keeps costs under control. While auto-scaling itself usually doesn’t have direct charges, the resources it scales and the monitoring services involved can add to your bill. Still, when set up correctly, auto-scaling can result in significant savings - sometimes over 40%.
To get the most out of these features, take the time to understand your cloud provider’s pricing structure and fine-tune these tools to match your specific requirements.
How do geographic response times and serverless cold starts impact cloud application performance?
Geographic response times are a key factor in how well cloud applications perform, directly impacting latency and the overall user experience. By routing requests to the closest data center, applications can minimize delays and deliver faster responses. This approach also boosts reliability since traffic can be rerouted to other regions if a local data center experiences an outage.
On the flip side, serverless cold starts can introduce delays when a function is triggered after sitting idle for some time. These delays occur because the cloud provider needs to spin up a new execution environment, a process that takes time. The size of the function and its runtime environment play a big role in how noticeable these delays are, particularly during periods of high demand. Keeping these factors in check is crucial for ensuring cloud applications run smoothly.