
Browser extensions can save you time and simplify your web development tasks. Here are five essential tools to improve debugging, testing, and performance:
- Hoverify: Combines multiple tools like an Inspector, Responsive Viewer, tech stack analysis, and asset extraction. Available for $30/year or $99 lifetime.
- Web Developer: Adds a toolbar with live CSS/HTML editing, DOM inspection, cookie management, and SEO tools.
- React Developer Tools: Debug React apps with a component tree, props/state inspection, and performance profiling.
- Lighthouse: Google’s tool for performance, accessibility, SEO audits, and actionable insights.
- JSON Formatter: Formats JSON data for easy readability and debugging.
Quick Comparison
| Tool | Purpose | Key Features | Price |
|---|---|---|---|
| Hoverify | All-in-one development toolkit | Inspector, Responsive Viewer, asset extraction | $30/year, $99 lifetime |
| Web Developer | Core dev tools | Live editing, DOM inspection, SEO tools | Free |
| React Dev Tools | React app debugging | Component tree, props/state inspection | Free |
| Lighthouse | Performance testing | Site audits for speed, SEO, accessibility | Free |
| JSON Formatter | JSON data viewer | Syntax highlighting, collapsible trees | Free |
These tools can enhance your workflow, but always download from trusted sources, check reviews, and keep extensions updated for security.
1. Hoverify: All-in-One Development Tool
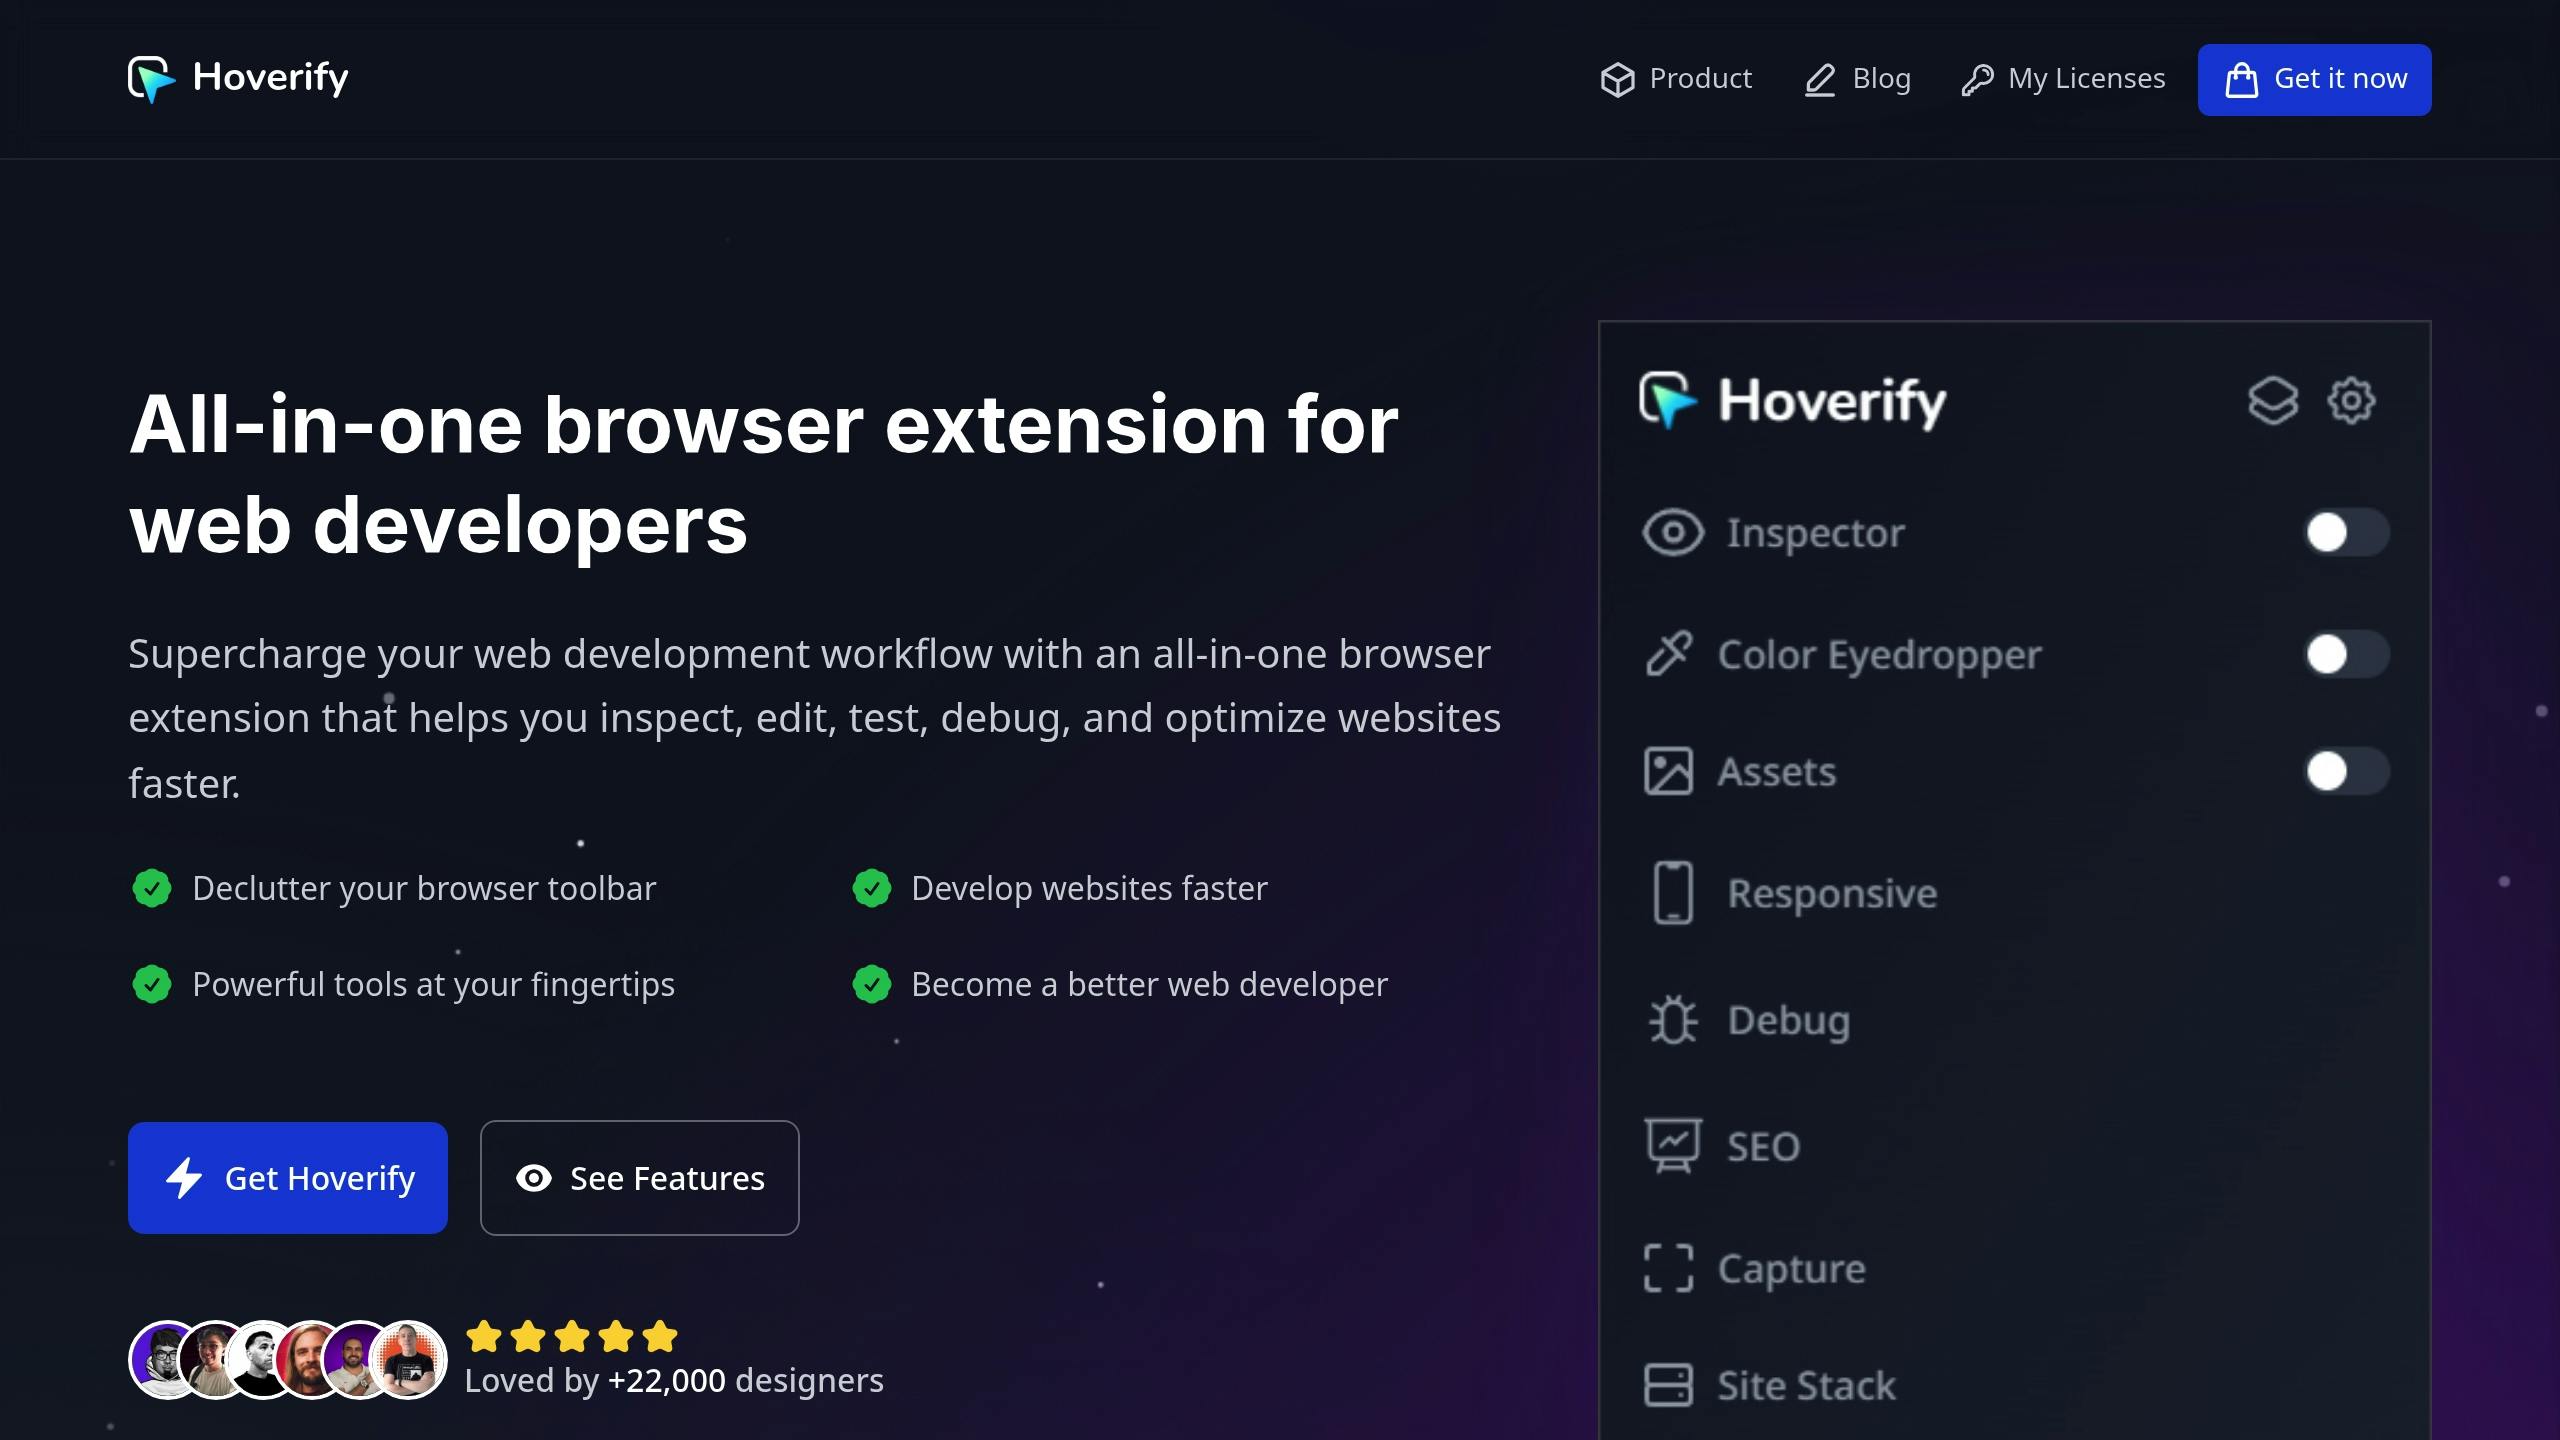
Hoverify is a browser extension designed to streamline web development by combining a range of tools into one package. Trusted by over 22,000 developers [1], it simplifies workflows and reduces the need for multiple extensions cluttering your toolbar.
One of its key features is the Inspector tool, which eliminates the hassle of constantly opening developer tools. Just hover over any HTML or CSS element to inspect it, make real-time edits, test changes, or export components directly to CodePen with a single click.
Hoverify also shines with its Responsive Viewer, a feature that lets you test your website across multiple device sizes at the same time. With synchronized interactions, you can ensure a consistent experience across various screen resolutions. Features of the Responsive Viewer include:
- Custom device profiles
- Simulated device frames and operating systems
- Testing on large viewports
- User-agent string modification
For managing assets, Hoverify offers a robust extraction tool. This allows you to grab images, SVGs, videos, PDFs, and even Lottie animations from any webpage with a single click - perfect for working on complex projects or gathering resources.
Developers have praised Hoverify’s all-in-one approach:
“As a website developer, this plugin has so many handy features…I love that everything is all in one place and consistent across different browsers and devices. Highly recommend.” – Terri Tutich
Hoverify also provides tech stack analysis, revealing the frameworks, libraries, and plugins used on websites. This feature offers valuable insights into site architecture and compatibility.
The extension is available in two pricing options: a $30/year subscription (3 activations, 14-day refund policy), and $89/one-time lifetime deal.
Additional features include debugging tools for clearing browsing data and injecting custom code, built-in SEO tools, and a screenshot function to document your work. Hoverify supports Chrome, Firefox, and Chromium-based browsers like Brave and Edge, ensuring consistent performance across platforms.
Regular updates and a responsive support team make Hoverify a reliable tool for developers:
“Hoverify does an exceptional job at taking information from the ‘Inspect’ tool and consolidating it into an all-in-one application that’s user-friendly.” – John Angelo Yap
2. Web Developer: Core Development Features

The Web Developer extension, rated 4.5/5 by over 2,800 users [2], adds a toolbar packed with tools for working with CSS, HTML, and JavaScript. Its features are grouped into categories like CSS editing, element controls, cookie management, image tools, form utilities, page outline visualization, and site data collection.
One standout feature is the ability to edit CSS and HTML live, skipping the usual code-save-refresh routine. This real-time feedback helps improve code accuracy. The extension also validates HTML and CSS, checks for broken links, and evaluates accessibility.
The DOM Inspector is another handy tool, showing element hierarchies to simplify debugging for intricate layouts or JavaScript problems.
In addition to coding tools, it offers support for technical SEO and performance evaluations. You can measure page size, check element dimensions, assess viewport settings, and ensure device compatibility. Its image tools help identify broken images, view image dimensions and file paths, and reload images when needed.
The extension is compatible with Windows, Linux, and macOS, ensuring it works smoothly across different systems. By combining these tools into a single toolbar, Web Developer makes each step of the development process faster and more efficient.
3. React Developer Tools: React App Debugging

React Developer Tools is an open-source extension from Meta, designed to help React developers debug and enhance their applications. With over 4 million installations [4], it provides detailed insights into component hierarchies, including props, state, and hooks.
The Components tab is your main hub, offering a clear view of your app’s component tree. You can inspect components and even tweak props in real time. On top of that, the extension includes a Profiler that makes performance debugging much easier.
The Profiler identifies performance issues by recording render data and displaying it through three views: Flamegraph, Ranked, and Timeline. These views let you see render duration, rank components by render time, and follow render sequences [7].
For instance, Netlify’s team used the Profiler to optimize their DeployLogContainer component on app.netlify.com. By debouncing setState, they reduced unnecessary renders, leading to smoother log displays [6].
You can also enable the ‘Highlight updates when components render’ feature. This visually marks components that re-render, making it easier to identify inefficiencies. Additionally, context inspection ensures global state is shared correctly.
When working in production, use the special profiling bundle to debug efficiently without affecting performance. The tool also includes a search function to navigate large component trees by name. Unlike Chrome DevTools, React Developer Tools frames your app in a React-specific context, making debugging much more straightforward [5].
4. Lighthouse: Site Performance Testing
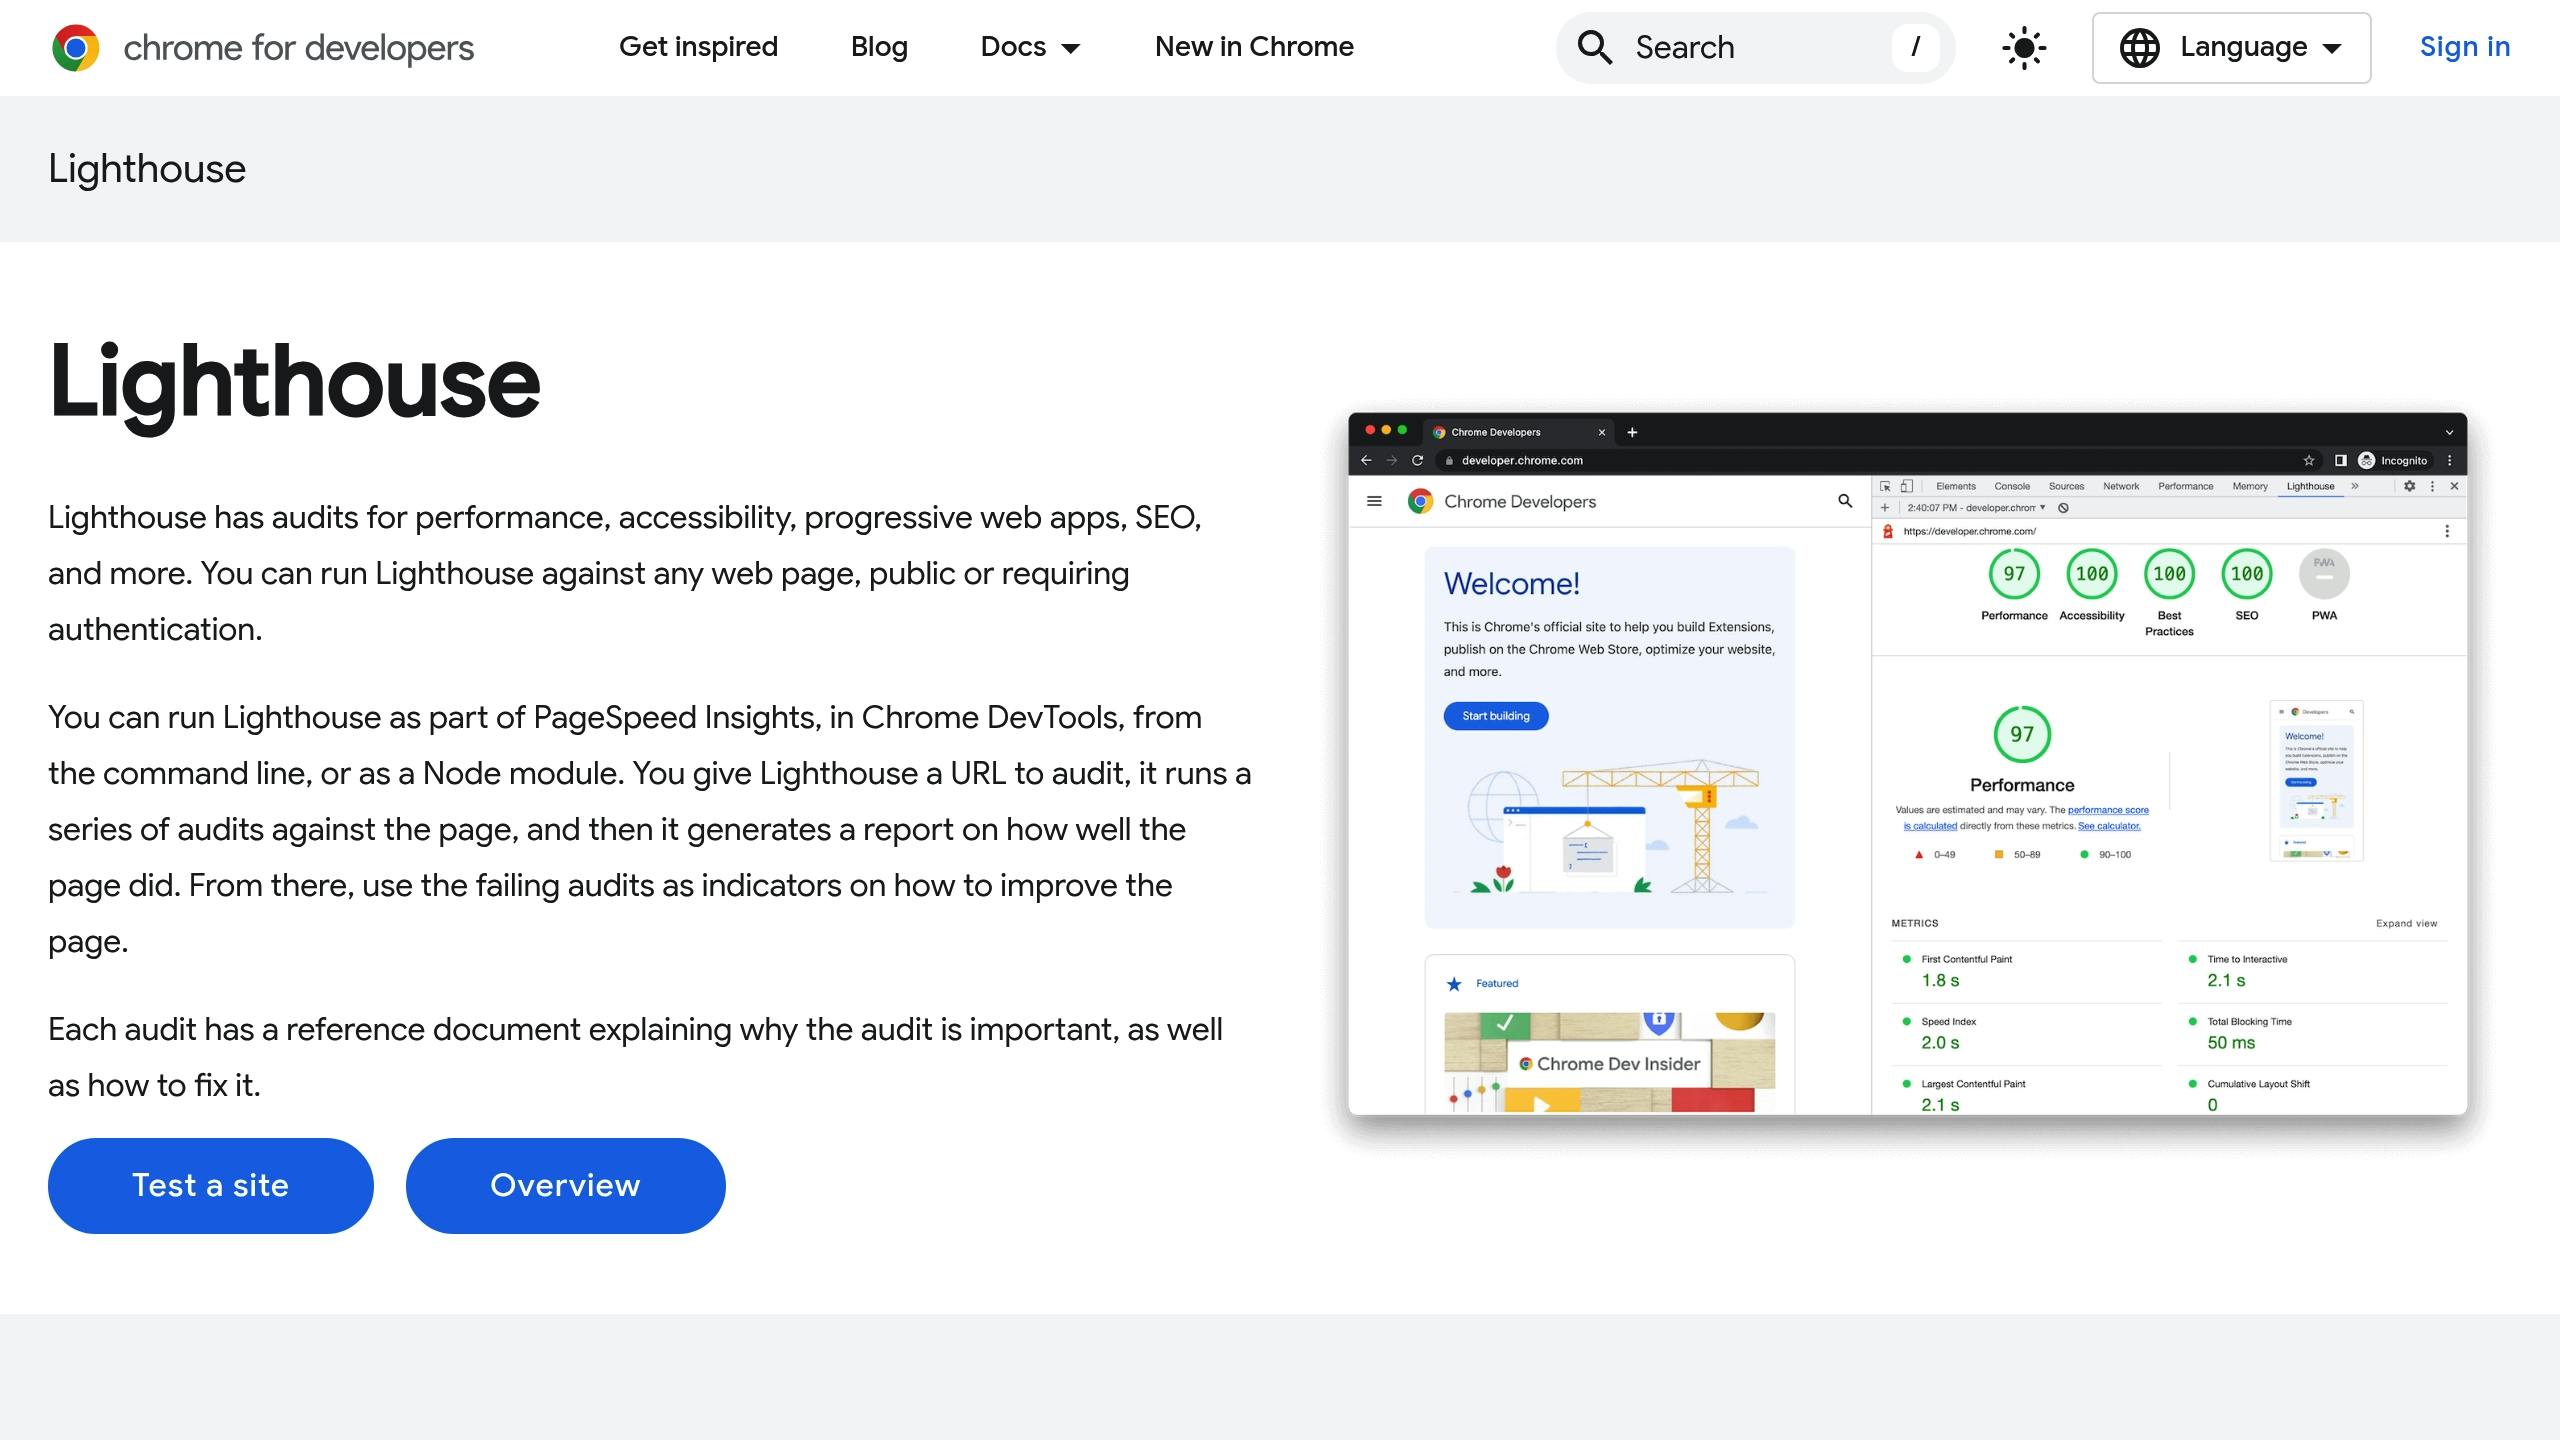
Lighthouse is Google’s automated tool for analyzing websites. It generates detailed reports across four main areas: Performance, Accessibility, Best Practices, and SEO. In less than a minute, it provides developers with actionable insights to improve their sites.
Lighthouse evaluates performance using metrics that directly influence user experience. For example, to achieve a strong performance score, your site should aim for:
- Largest Contentful Paint (LCP): 2.5 seconds or less
- Cumulative Layout Shift (CLS): Below 0.1
- Total Blocking Time (TBT): Under 200 milliseconds
Here’s a quick look at how some metrics are graded:
| Performance Metric | Good Score | Moderate Score | Poor Score |
|---|---|---|---|
| Speed Index | 0–3.4 seconds | 3.4–5.8 seconds | >5.8 seconds |
| Layout Shift | <0.1 | 0.1–0.25 | >0.25 |
These benchmarks help developers pinpoint areas for improvement to deliver smoother user experiences.
Lighthouse is widely used across platforms for automated performance tracking. For instance, Calibre integrates Lighthouse data to review GitHub Pull Requests, allowing developers to catch issues early. Similarly, SpeedCurve aggregates scores across multiple pages and sends alerts when performance thresholds are exceeded.
The tool’s Opportunities section highlights fixes ranked by their potential impact, such as compressing images or removing render-blocking resources. Testing on both mobile and desktop is crucial, as Lighthouse simulates slower network conditions to uncover hidden bottlenecks.
For added functionality, Lighthouse integrates with CI systems like Lighthouse CI and uses axe-core to provide accessibility insights, including checks for color contrast and ARIA standards compliance.
5. JSON Formatter: Data Structure Viewer
JSON Formatter extensions turn raw JSON data into an easy-to-read, structured format, making it simpler to inspect and debug. These tools are a great addition to any developer’s toolkit.
One standout is JSON Formatter by Callum Locke, which can handle files up to 200MB and flags syntax errors in real time. This helps developers quickly identify and resolve issues [9].
Here’s a quick comparison of popular JSON formatting extensions:
| Extension | Key Features | Rating |
|---|---|---|
| JSONView | Tree view, schema validation, JSON patching | 4.8/5 (1M+ users) |
| JSON Formatter | 60+ themes, offline support, privacy-focused | 4.7/5 (800K+ users) |
| Tulios JSON Viewer | 27 themes, collapsible nodes, large number support | 4.5/5 (1.1K+ users) |
Key Features These Tools Offer:
- Syntax Highlighting: Color-coded elements make it easy to distinguish between data types.
- Collapsible Trees: Expand or collapse sections to navigate complex nested structures effortlessly.
- Error Detection: Instant feedback on syntax and structural issues.
- Data Privacy: All processing happens client-side, keeping sensitive data secure [8].
For added convenience, developers can use keyboard shortcuts and bookmarklets to format JSON quickly [9].
Some advanced features include:
- Automatic metrics for document size, field counts, and depth levels [9].
- Customization options, like adjusting indentation size and syntax highlighting, to streamline workflows.
These tools are also great for collaborative API work. They support both formatted and minified JSON views, making debugging easier while ensuring production performance remains optimal [10]. The ability to toggle between raw and parsed views is especially useful for verifying data integrity during development.
Conclusion
Browser extensions can boost productivity and simplify workflows in web development. Chrome’s developer ecosystem, in particular, provides tools that address a variety of common challenges.
Here’s a quick look at some key tools for different development needs:
| Development Area | Recommended Extension | Key Benefit |
|---|---|---|
| Debugging | React Developer Tools | Inspect components in real-time |
| Performance | Lighthouse | Automated performance audits |
| Data Handling | JSON Formatter | Easy-to-read data visualization |
| All-in-One | Hoverify | A suite of tools in one extension |
However, as Michael Leland, Field CTO at Island, warns: “The same capabilities that make extensions a powerful productivity and automation tool can be exploited to push spam, harvest personal details, or even exfiltrate session tokens and passwords” [13]. This highlights the need to keep extensions updated, monitor their impact on browser performance, and choose tools that meet specific needs instead of installing everything available [12][3].
A great example of effective extension use comes from BrowserStack. Their tools helped Optimizely cut testing time from an entire day with eight engineers to just one hour, enabling daily releases. This shows how carefully chosen extensions, combined with attention to security and performance, can transform workflows.
That said, extensions should complement - not replace - core development skills. For instance, using breakpoints for debugging is often more reliable than depending solely on console.log() statements [11]. A balanced approach ensures both productivity and quality in development.