Third-party scripts can slow down your website. They add extra load time, delay rendering, and hurt user experience. But you can measure and improve their performance with the right tools and strategies. Here’s how:
- Identify Scripts: Use Chrome DevTools or tools like Hoverify to find all external scripts on your site.
- Evaluate Impact: Check metrics like load time, execution duration, and memory usage using tools like Lighthouse.
- Optimize Loading: Load scripts asynchronously, defer non-essential ones, or load them on-demand.
- Reduce Script Size: Minify, compress, and split large scripts into smaller chunks.
- Test Scenarios: Simulate slow networks, low-powered devices, and caching states to measure performance.
Quick Tip: Focus on high-impact scripts (e.g., ads, analytics) first, as they often cause the most delays.
Finding Third-Party Scripts on Your Site
Before improving your site’s performance, it’s important to identify all third-party scripts in use. Here’s how you can find and categorize these scripts effectively.
Chrome DevTools Analysis

Start by opening Chrome DevTools (press F12 or Ctrl+Shift+I) and follow these steps:
- Go to the Network tab.
- Filter for ‘JS’ requests to locate scripts from external domains.
- Sort the results by size or load time to identify scripts that use the most resources.
Check the Waterfall view to see which scripts are delaying other resources from loading. For more detailed insights, try tools like Hoverify to identify script details.
Script Detection Tools
Hoverify is a helpful tool for analyzing the tech stack of any website. It quickly identifies external scripts and technologies, providing details such as:
- Script sources and domains
- Loading priorities
- Resource sizes
- Technology dependencies
You can use its inspector feature to examine how scripts are implemented and their potential impact on your site.
Script Classification
Once you’ve identified the scripts, group them into categories to prioritize which ones to optimize first.
| Script Category | Purpose | Performance Impact |
|---|---|---|
| Analytics | Tracks user behavior | Medium - can slow page load |
| Marketing | Conversion tracking, A/B testing | High - involves multiple HTTP requests |
| Functionality | Core features, widgets | Variable - depends on implementation |
| Social Media | Share buttons, embeds | Low-Medium - often loads asynchronously |
| Advertising | Ad delivery, tracking | High - impacts rendering and interactivity |
When evaluating these scripts, consider:
- How they load (synchronously or asynchronously)
- Their resource usage
- Network demands
- Execution timing
This classification helps you focus on optimizing scripts with the greatest impact on your site’s performance.
Measuring Script Performance
Evaluate the performance of third-party scripts using reliable tools and methods.
Chrome DevTools Performance Profile
Use the Performance tab in Chrome DevTools to record and analyze site activity. Focus on these key metrics:
| Metric | What to Look For | Impact Level |
|---|---|---|
| Main Thread | Script blocks lasting over 50ms | High |
| JavaScript Heap | Noticeable memory usage spikes | Medium |
| Network Requests | Delays in waterfall timing | High |
| CPU Usage | High peaks indicating heavy script activity | Medium |
The flame chart is particularly helpful for spotting long-running scripts and identifying JavaScript execution issues. Additionally, tools like Hoverify can provide detailed insights into script behavior.
For a more comprehensive view, pair manual profiling with automated testing using Lighthouse.
Lighthouse Performance Tests

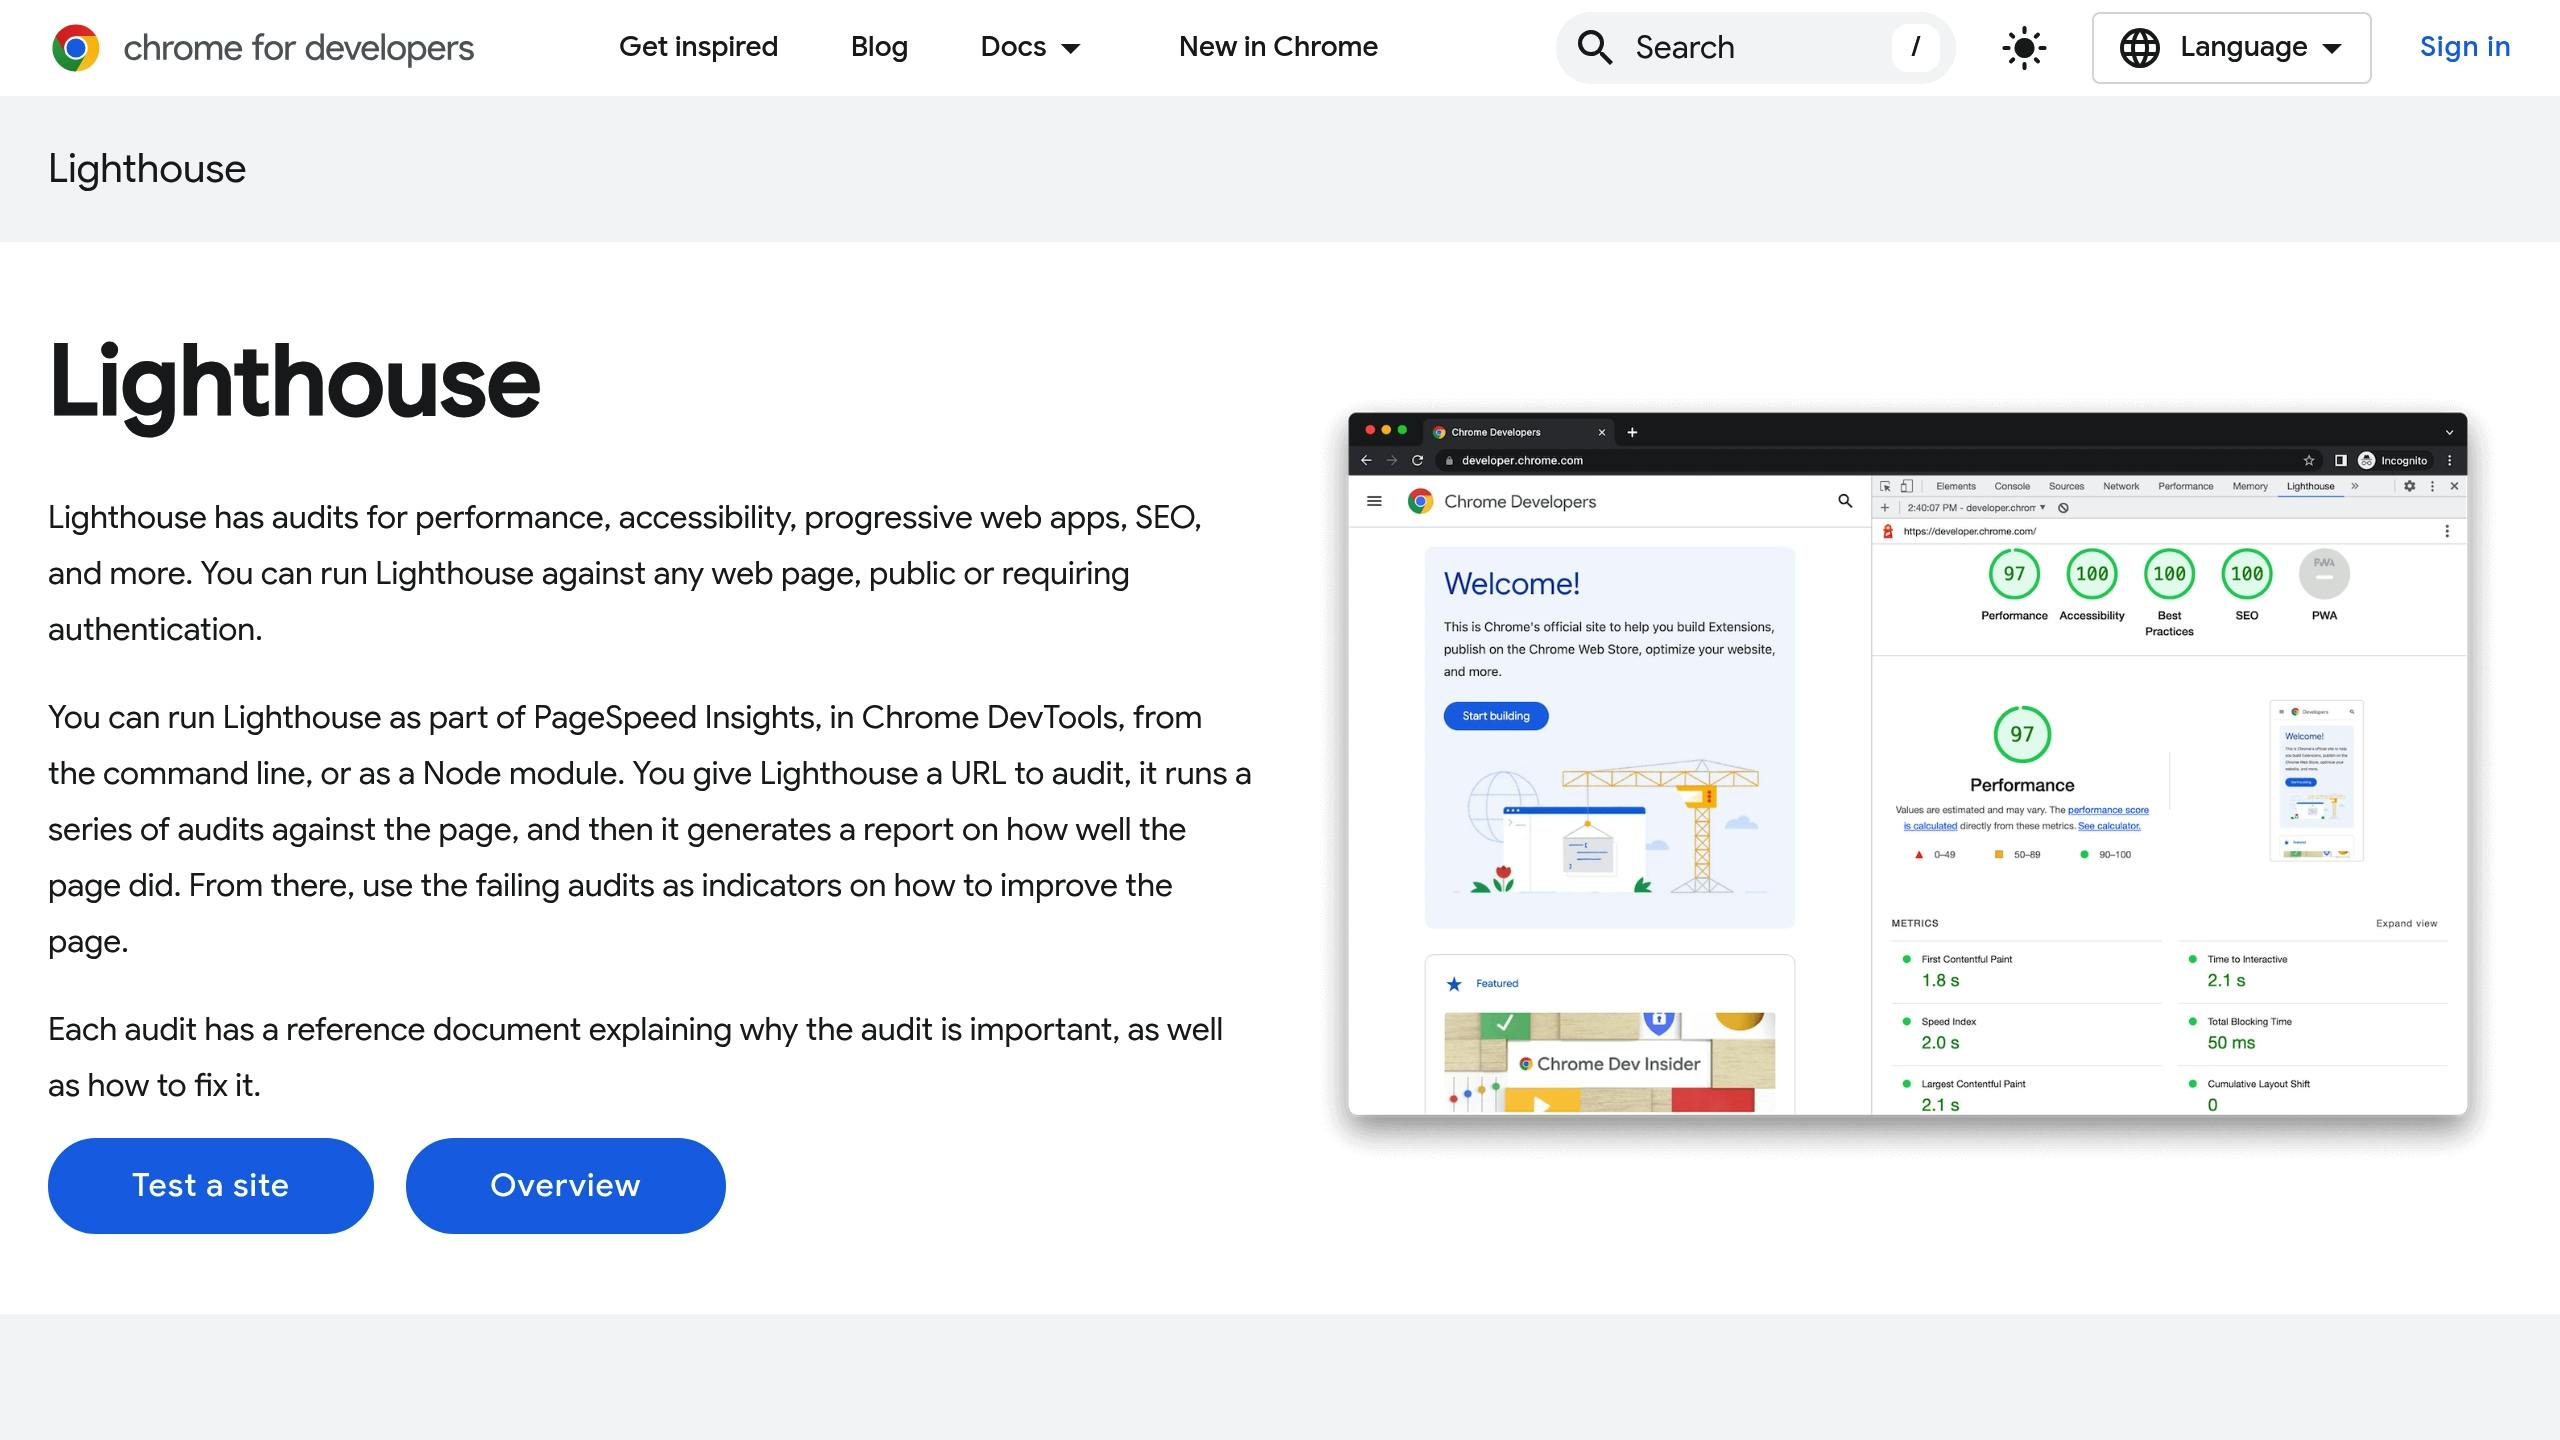
Lighthouse offers automated performance insights. Pay attention to these indicators:
- Total Blocking Time (TBT): Highlights how scripts affect page interactivity.
- Time to Interactive (TTI): Indicates when the page becomes fully usable.
- JavaScript Execution Time: Shows the processing load caused by scripts.
Run tests in incognito mode to avoid interference from browser extensions.
Load Testing Scenarios
Simulate real-world conditions to understand script performance under different scenarios:
1. Network Throttling Tests
Test how scripts perform under varying network speeds:
- Fast 3G (1.6 Mbps)
- Slow 3G (780 Kbps)
- Offline mode
2. Device Performance Testing
Simulate different device capabilities by applying CPU throttling at baseline, 4x, and 6x levels.
3. Cache Testing
Evaluate performance in different caching states:
- Empty cache for first-time visits
- Primed cache for returning users
- Partially cached resources
Track key metrics like initial load time, Time to First Byte (TTFB), script execution duration, memory usage, and network request patterns. Use these measurements to establish performance benchmarks and guide future optimizations.
Script Performance Improvements
After identifying performance issues, use these strategies to make your scripts run more efficiently.
Load Scripts On-Demand
You can reduce the impact of third-party scripts by loading them only when needed. This approach shortens initial page load times and improves key performance metrics.
-
Figure Out Trigger Points: Pinpoint specific user actions that require third-party scripts. Examples include:
- Form tracking
- Social media widgets
- Chat support tools
- Video players
- Analytics
-
Set Up On-Demand Loading: Use event listeners to load scripts only when triggered. Here’s an example:
document.getElementById('chat-button').addEventListener('click', function() { const script = document.createElement('script'); script.src = 'chat-widget.js'; document.body.appendChild(script); }); -
Monitor Performance: Use developer tools or apps like Hoverify to ensure scripts load as expected when triggered.
Script Loading Methods
Choosing the right script loading method can make a big difference in performance. Here’s a quick guide:
| Loading Method | Best For | Impact |
|---|---|---|
| Regular | Critical scripts needed for rendering | Blocking |
| Async | Independent scripts that don’t rely on others | Less blocking |
| Defer | Non-essential scripts | Loads after parsing |
| Module | Modern ES6 modules | Allows tree-shaking |
Tools like Hoverify can help you analyze your current setup and find areas for improvement.
Script Size Reduction
Reducing the size of your scripts is another way to improve performance. Here’s how:
- Break It Up: Use code splitting to divide large scripts into smaller chunks. Load features as needed and use dynamic imports for specific routes.
- Compress: Enable Gzip or Brotli compression, minify your JavaScript, and remove unnecessary code.
- Optimize Resources: Use preconnect for critical domains, dns-prefetch for third-party origins, and preload essential scripts.
Mix and match these techniques to suit your project’s needs.
Performance Reporting
After improving third-party scripts, the next step is to document their impact on performance and share this information with all stakeholders.
Creating Performance Reports
Performance reports should focus on the metrics that matter most to stakeholders. Using detailed data from tools like DevTools and Lighthouse, these reports bring together key numbers to guide decisions.
Core Performance Metrics
| Metric Type | Technical Metrics | Business Impact |
|---|---|---|
| Loading | Time to First Byte (TTFB), First Contentful Paint (FCP) | Page load speed in seconds |
| Execution | JavaScript execution time, Memory usage | CPU/Memory overhead |
| Network | Bandwidth consumption, Request count | Data transfer costs |
| Business | Bounce rate impact, Conversion rate changes | Revenue impact |
Key Report Sections
- Executive Summary: A one-page snapshot of findings and recommendations.
- Performance Timeline: Tracks changes in script performance over time.
- Impact Analysis: Explores how script performance affects user experience and revenue.
- Action Items: Lists specific areas for improvement with estimated benefits.
Tools like Hoverify can help automate the creation of precise and detailed reports.
Presenting to Stakeholders
When sharing performance data, focus on how it affects both the user experience and business outcomes.
Simplify Technical Metrics
Explain technical metrics in terms of business impact. For example: “A 500ms delay in execution time could add half a second to the checkout process, potentially reducing revenue.”
Use visuals to make your points clear and compelling.
Visualizations
Include charts and graphs that compare performance before and after optimizations. Highlight trends, cost savings, and user experience improvements.
Real-World Improvements
Provide examples that show the connection between performance changes and business outcomes:
| Performance Change | Business Impact |
|---|---|
| 2-second reduction in load time | 15% lower bounce rate |
| Optimized ad scripts | 30% better Core Web Vitals scores |
| Delayed non-critical scripts | 25% faster initial page load |
By linking technical changes to measurable benefits, you can help stakeholders see the value of ongoing performance work.
Next Steps
Based on the data, outline clear recommendations. Include details like how long implementation will take, the expected benefits, required resources, and potential return on investment.
Hoverify’s reporting tools can streamline this process, making it easier to share actionable insights with your team and stakeholders.
Conclusion
Balancing how scripts function with how they perform is crucial for delivering a smooth user experience. Measuring and improving the performance of third-party scripts requires a structured approach that blends technical analysis with ongoing monitoring. This approach helps improve loading times and overall user satisfaction while still allowing the use of necessary third-party features.
To measure performance effectively, tools like Chrome DevTools and Lighthouse provide insights into script behavior, while Hoverify simplifies debugging with features like Inspector and Site Stack, making it easier to verify changes.
When working to improve third-party scripts, focus on these three key areas:
- Performance Monitoring: Keep track of how scripts affect load times and resource usage.
- Smart Loading: Use appropriate methods to load scripts without causing delays.
- Frequent Updates: Adjust script implementations based on the latest performance data.
These steps serve as the foundation for ongoing performance improvements.
