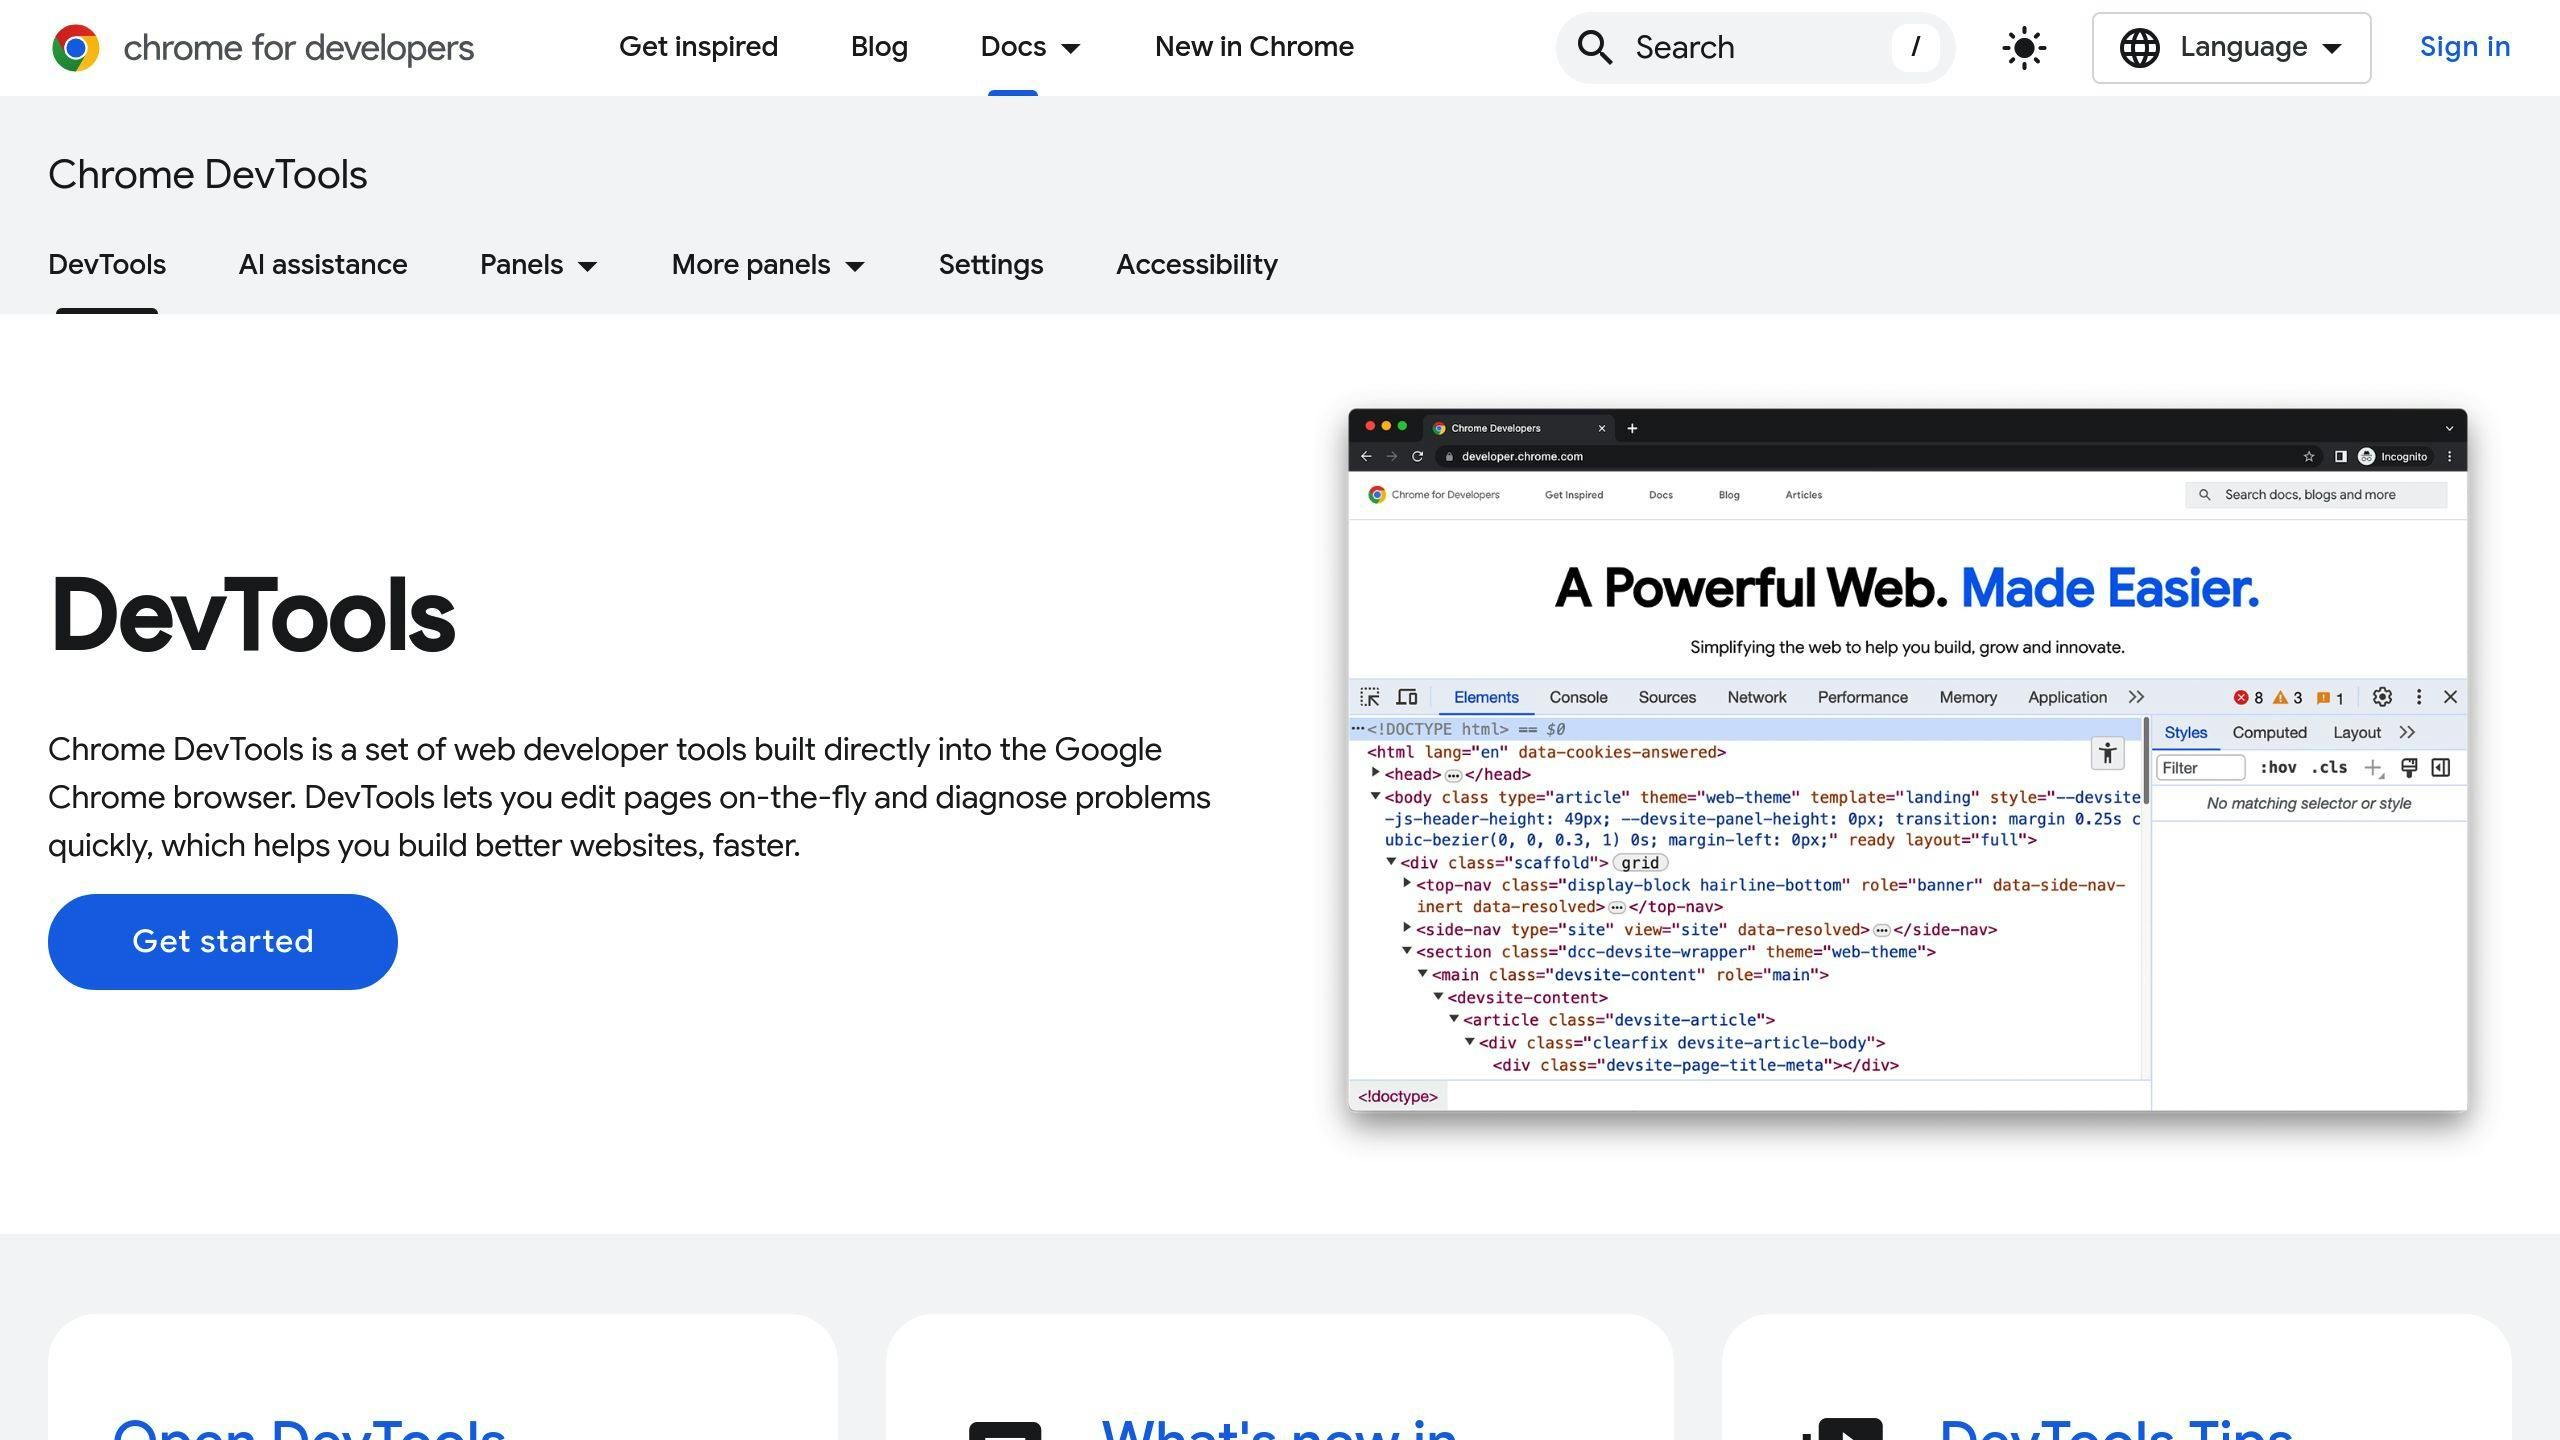
Want to test your website on slow internet? Chrome DevTools lets you simulate different network speeds to see how your site performs under various conditions. This helps identify loading issues and improve user experience for people on slower connections. Here’s how:
- Access DevTools: Right-click a webpage and select “Inspect” or press
Ctrl+Shift+I(Windows/Linux) orCmd+Opt+I(Mac). - Use Presets: Choose options like “Fast 3G” or “Slow 3G” from the Network > Throttling menu.
- Create Custom Profiles: Set specific speeds, latency, and upload/download limits under Custom > Add….
- Clear Cache: Perform an “Empty Cache and Hard Reload” to ensure accurate testing.
For more advanced simulations, tools like BrowserStack, Fiddler, or Hoverify can enhance your testing process. Ready to optimize your site for all users? Let’s dive in!

How to Throttle Network Speed in Chrome DevTools
Chrome DevTools lets you simulate different network conditions, making it easier to test how your website performs for users on slower or unstable connections.
Accessing DevTools Network Controls
To open DevTools, right-click on any webpage and choose “Inspect” or use keyboard shortcuts (Ctrl+Shift+I for Windows/Linux, Cmd+Opt+I for Mac). Once inside, go to the ‘Network’ tab and find the ‘Throttling’ dropdown menu.
Using and Customizing Throttling Profiles
DevTools offers preset profiles like Fast 3G and Slow 3G to mimic common mobile network speeds. Here’s a quick breakdown of the default options:
| Profile | Latency | Bandwidth | Use Case |
|---|---|---|---|
| Fast 3G | 562.5ms | 1.44 Mbps | Simulating decent mobile speeds |
| Slow 3G | 2000ms | 400 Kbps | Testing poor mobile connections |
| No throttling | 0ms | - | Normal browser performance |
To use a profile, simply select it from the ‘Throttling’ menu in the Network tab. If you need more tailored testing, you can create custom profiles by navigating to ‘Custom’ > ‘Add…‘. Configure options like:
- Download speed
- Upload speed
- Latency
- Optional: packet loss
Keep in mind that Chrome DevTools applies delays after server responses, so it doesn’t fully replicate all network behaviors, such as DNS resolution or SSL handshakes [1].
Mastering these tools allows you to better understand how your site performs under different conditions. Up next, we’ll dive deeper into optimizing these tests.
Explaining Throttling Profiles and Settings
Throttling profiles help developers mimic mobile network conditions to spot and fix performance issues effectively.
Overview of Preset Profiles
Chrome DevTools includes preset profiles designed to replicate typical mobile network scenarios. These presets align with Google’s Lighthouse tool, ensuring consistent performance testing results [1]. The two main options are:
- Fast 3G: Useful for testing average mobile network performance.
- Slow 3G: Helps uncover problems under poor connectivity conditions.
While these presets cover general use cases, custom profiles allow you to fine-tune network parameters for more specific testing needs.
How to Use Custom Profiles
Custom profiles let you simulate unique network conditions. To set one up:
- Open the Network tab in DevTools.
- Click the throttling dropdown menu.
- Choose “Add…” under the Custom section.
- Configure parameters like download/upload speed and latency.
However, keep a few things in mind when using custom profiles:
- Throttling doesn’t affect initial connection times.
- Server response times (like TTFB) will increase based on your settings.
- DNS resolution and TCP/SSL connections aren’t fully simulated.
Chrome DevTools applies higher latency to better mirror real-world slowdowns [1]. This approach ensures your tests reflect realistic conditions, even though the throttling simulation is somewhat simplified.
For the best results, combine throttling profiles with solid testing practices to get a clearer picture of how your website performs across different network conditions.
Other Tools for Network Throttling
Chrome DevTools is a powerful option for network throttling, but it’s not the only tool available. Depending on your testing requirements, other tools can offer additional features or a different approach to network simulation.
Using BrowserStack Live

BrowserStack Live allows you to test websites on real devices and browsers, offering both pre-set and customizable network profiles for 2G, 3G, and 4G connections. This is especially useful for evaluating mobile-responsive websites under realistic conditions.
Some of its standout features are:
- Simulating network conditions on multiple devices at the same time.
- Pre-set profiles for different network speeds.
- Custom profiles tailored to specific testing needs.
Simulating Networks with Fiddler

Fiddler is a great choice for more detailed network simulation, particularly for desktop applications. It gives you precise control over factors like latency, bandwidth, and packet loss, while also allowing you to monitor HTTP traffic. The tool is free, with optional paid features for advanced use.
Tips for Accurate Network Throttling
Using the right testing methods helps ensure your results reflect actual conditions users might experience.
Preparing for Accurate Testing
To get reliable testing results, follow these steps:
- Open Chrome DevTools by pressing F12 or right-clicking and selecting “Inspect”.
- Right-click the reload button in Chrome’s address bar.
- Select “Clear Site Data” to remove cached resources.
Why is this important? Cached resources are loaded from your device’s local storage rather than downloaded from the server. A regular page refresh often uses these cached files, which can skew your testing. To ensure every resource is freshly downloaded, perform an “Empty Cache and Hard Reload.”
Here’s how to do it in Chrome DevTools:
- Open DevTools (F12).
- Press and hold the reload button.
- Choose “Empty Cache and Hard Reload” from the dropdown menu [1].
This approach ensures two key things:
| Action | Effect on Testing |
|---|---|
| Clearing Cache | Deletes all saved website files from local storage. |
| Fresh Downloads | Forces the browser to fetch all assets directly from the server. |
Keep in mind, Chrome DevTools uses request-level throttling, which mainly impacts server response times [1]. For a more thorough analysis, consider combining network throttling with tools like Hoverify to debug and evaluate performance more effectively.
Conclusion
With web development increasingly focusing on performance and accessibility, network throttling has become a key part of effective testing. Using network throttling in DevTools, developers can simulate different network conditions to ensure websites work smoothly for all users.
The success of network throttling depends on using the right testing methods. While Chrome DevTools is a strong option, its request-level throttling mainly impacts server response times, which might not fully reflect actual conditions. As DebugBear points out:
Testing your site with request-level throttling can lead to lower metric accuracy, as the underlying differences in response time are hidden [1].
Different tools - like Chrome DevTools, BrowserStack, and Hoverify - bring distinct benefits, making it easier to test and fine-tune websites for varying network conditions. For instance, Chrome DevTools mimics slower connections by delaying server responses. When paired with thorough testing, these tools help developers gain deeper insights into site performance.
As web development shifts more toward mobile-first design and performance improvements, developers now have tools to test and debug under a range of network conditions. Adding network throttling to your process helps ensure a smooth experience for users, no matter their connection speed.
FAQs
How do I throttle my network speed in DevTools?
Here’s how you can slow down your network speed using Chrome DevTools:
- Open DevTools (right-click on the page and choose “Inspect”).
- Go to the Network tab.
- Click the throttling dropdown menu.
- Pick a preset profile (like Fast 3G or Slow 3G) or create your own.
- Reload the page to test how it performs under the selected conditions.
This allows you to test your website’s behavior under different network speeds, helping you identify and address potential issues.
How do I create custom throttling profiles?
If you need specific network conditions for testing, you can create a custom profile:
- Open the Network tab in DevTools.
- Click the throttling dropdown and choose Custom > Add….
- Set your preferred latency and bandwidth limits.
- Save the profile and apply it for testing.
Custom profiles are helpful for simulating unique scenarios that aren’t covered by the default presets.
How to simulate network throttling effectively?
To get the most accurate results when simulating throttled networks:
- Open DevTools and select the throttling profile you want to use.
- Perform a hard reload to ensure all resources load fresh.
- Use the Network panel to monitor performance metrics.
- Test key user actions while throttling is active.
- Take notes and analyze any performance issues you observe.
These steps help you understand how your site behaves under slow connections and pinpoint areas for improvement.
What is throttling in DevTools?
Throttling in DevTools is a feature that slows down your internet connection on purpose. It helps developers see how their websites perform under various network conditions. With throttling, you can:
- Test how your site runs on slower mobile connections.
- Work on improving loading times.
- Make sure users have a smooth experience.
- Spot and fix performance bottlenecks.
“Testing your site with request-level throttling can lead to lower metric accuracy, as the underlying differences in response time are hidden” [1].
