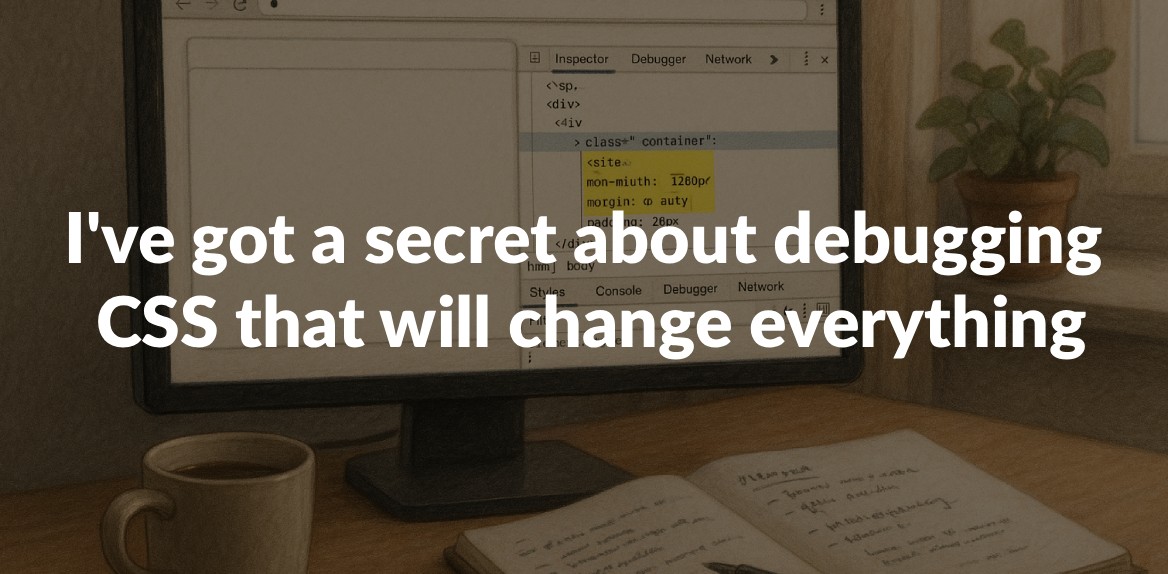
Debugging CSS can be a nightmare, but a tool called Hoverify is here to simplify the process. It combines multiple features into one browser extension, helping you fix common CSS problems like specificity conflicts, layout issues, and responsive design inconsistencies. With over 22,000 users, it’s gaining traction as a must-have for developers.
Here’s what makes Hoverify stand out:
- Hover-to-inspect: See CSS properties instantly by hovering over elements.
- Live editing: Adjust styles, HTML, and animations in real time.
- Responsive testing: Preview your site across devices with synced interactions.
- CSS Box visualization: Easily debug margins, padding, and borders.
- Asset management: Find and manage media files effortlessly.
For $30/year with no auto-renew, it’s a cost-effective way to save time and frustration while debugging CSS. Whether you’re dealing with browser quirks, tricky layouts, or responsive design, Hoverify simplifies the process and keeps everything in one place.
The Secret: How Hoverify Changes CSS Debugging
Hoverify takes the frustration out of CSS debugging and turns it into a smooth, visual experience. This browser extension replaces the need for multiple tools by combining everything into a single, easy-to-use interface. With over 22,000 developers already on board, it’s no wonder Hoverify is becoming a go-to solution for front-end workflows.
What Makes Hoverify Stand Out
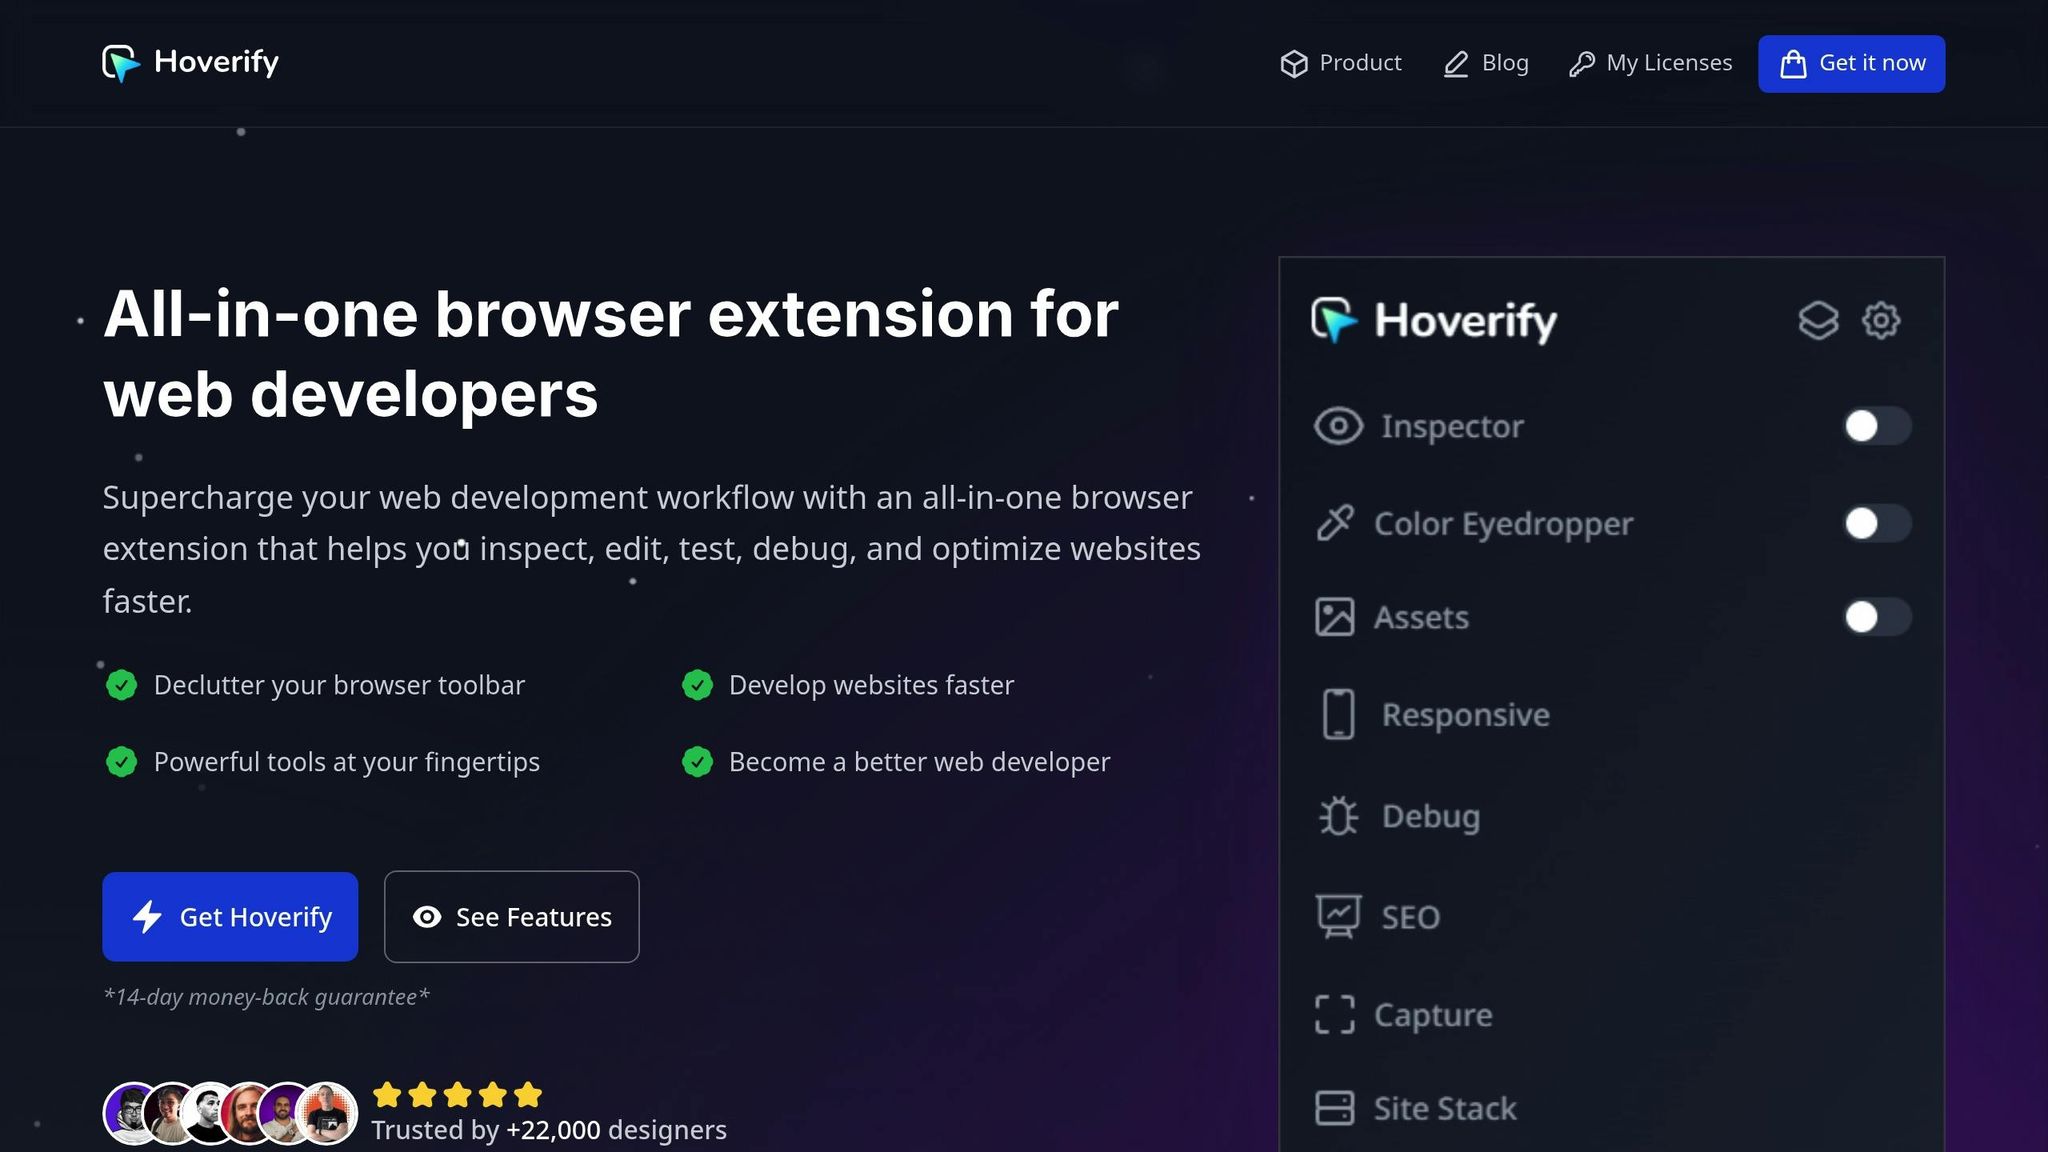
Hoverify introduces features that redefine how developers debug CSS. Its standout hover-to-inspect functionality allows you to instantly see CSS properties, HTML structure, and styling details just by hovering over any element - no need for the usual right-click inspect routine. Even better, you can edit CSS properties and HTML content in real time, seeing immediate results. This not only simplifies debugging but also saves valuable time.
“As a website developer, this plugin has so many handy features…I love that everything is all in one place and consistent across different browsers and devices. Highly recommend.” – Terri Tutich
The extension also presents debugging information in a clean, organized layout, cutting out the clutter. As John Angelo Yap puts it:
“Hoverify does an exceptional job at taking information from the ‘Inspect’ tool and consolidating it into a user-friendly interface.”
Hoverify works seamlessly across major browsers like Chrome, Firefox, and Chromium-based options such as Brave and Edge, ensuring a smooth experience no matter where you’re working.
Key Features for CSS Debugging
Hoverify is packed with tools designed to tackle common CSS challenges. At its core is the Inspector tool, which lets you examine elements by simply hovering over them. Even tricky pseudo-elements and classes are easy to inspect. The tool highlights syntax and supports real-time edits for HTML, styles, media queries, and animations. You can also adjust styles visually, eliminating the need to type out property values manually.
Its CSS Box Model visualization makes it simple to diagnose layout issues by clearly showing padding, margins, borders, and element dimensions. The Responsive Viewer takes things a step further, letting you preview your site across multiple devices simultaneously, with synchronized interactions.
Other handy tools include a color eyedropper, a font viewer, and a powerful search function to help you quickly find and fix issues.
“Found an incredibly useful web design / development tool called Hoverify. Allows you to inspect elements on any site, copy styles, show grids, check on different viewports, grab asset lists, hide elements, and a whole lot more.” – Madhu Menon
Together, these features create a faster, more efficient way to debug CSS, making Hoverify an essential tool for developers.
How to Debug CSS with Hoverify: Step-by-Step Guide
Efficiency is key when debugging CSS, and Hoverify offers a streamlined approach to identifying and resolving issues. Here’s how you can use Hoverify to debug CSS effectively.
Find Elements and Spot Issues Instantly
The first step in debugging CSS is figuring out which element is causing the problem. Hoverify’s Inspector tool simplifies this process. Just hover over an element to instantly see its CSS properties, HTML structure, and styling details - no need to open the browser’s developer tools.
One standout feature is its ability to inspect pseudo-elements and classes, which are often tricky to access with standard tools. This means you won’t miss any hidden styling details.
The Inspector also highlights syntax for better readability. This makes it easier to catch common issues like missing semicolons, incorrect property values, or conflicting styles. If you’re working with a complex layout, Hoverify’s search functionality lets you quickly locate elements by tag name, ID, class, or even CSS selectors.
Once you’ve identified the issue, you can use Hoverify’s live editing tools to test and apply fixes immediately.
Make Live Style Changes and Test Responsiveness
After pinpointing the problematic element, Hoverify’s Visual Style Editor allows you to make real-time adjustments. Simply click on an element to enter edit mode and tweak its CSS properties. Changes are applied instantly, so you can experiment and refine your design without needing to switch tools or refresh the page.
This editor eliminates the need for manual code entry, making it easy to adjust margins, padding, colors, and more through an intuitive interface.
Hoverify also simplifies responsive design testing with its Responsive Viewer. This tool lets you preview your site on multiple devices at once, with synced interactions. For example, when you click or scroll on one device preview, all others mirror the action. This makes it easy to identify and fix responsive design issues.
The Responsive Viewer supports multiple screen sizes and orientations, and you can even add custom device profiles to test specific dimensions relevant to your project. By testing across devices in parallel, you can address responsive issues early in the process rather than discovering them later.
Once your live edits are confirmed, you can move on to inspecting assets and fine-tuning your layout.
Inspect Assets and Solve Layout Issues
Debugging layouts often involves examining how images, SVGs, and other assets interact with your CSS. Hoverify’s Assets tool gathers all media files from your page, including those from iframes and hidden elements. This gives you a clear view of oversized images, missing files, or improperly formatted media that might be causing layout issues.
For spacing and alignment problems, the CSS Box feature is invaluable. It lets you inspect padding, margins, borders, and dimensions directly on the page, making it easy to identify where spacing issues originate.
If you’re dealing with layout shifts or alignment problems, Hoverify’s Hide or Remove Elements feature can help. Temporarily removing elements lets you isolate the culprits behind layout disruptions, overflow issues, or misaligned components.
Additionally, Hoverify includes Guidelines and Grids to check the vertical and horizontal alignment of elements, helping you better understand your page’s overall structure.
Old Methods vs. Hoverify: Side-by-Side Comparison
Let’s dive into how traditional CSS debugging stacks up against Hoverify’s streamlined approach. With the old methods, developers often juggle multiple tools and perform repetitive manual tasks that disrupt the flow of solving CSS issues. This means constantly opening and closing browser developer tools, manually toggling element states, and refreshing pages to test changes. It’s a workflow full of interruptions that can make resolving complex CSS problems feel like a chore. Hoverify, on the other hand, simplifies everything into a seamless, unified process. Here’s a side-by-side look at how the two approaches compare.
Key Differences Between Traditional Tools and Hoverify
| Feature | Traditional Browser Dev Tools | Hoverify |
|---|---|---|
| Element Inspection | Requires navigating the Elements panel | Hover-to-inspect functionality |
| Live Editing | Possible but involves more steps and lacks intuitiveness | Real-time editing of HTML, styles, and media queries |
| Responsive Testing | Manual adjustments and device emulation | Multi-device preview with synchronized interactions |
| Asset Extraction | Manual process for finding and downloading assets | One-click extraction of various asset types |
| Pseudo-class Debugging | Difficult to inspect pseudo-classes and media queries | Real-time inspection and editing for all screen sizes and animations |
| Tool Management | Requires multiple extensions, leading to clutter | All-in-one solution with a clean, intuitive interface |
| Workflow Efficiency | Frequent switching between browser and tools | Inspect HTML and CSS simply by hovering over elements |
Hoverify doesn’t just save time - it transforms how you work. Traditional tools often force you to switch contexts, breaking your concentration and slowing down progress. For example, debugging interactive elements like buttons or dropdowns often means manually toggling states repeatedly. Hoverify’s “freeze” feature eliminates this hassle by locking elements in specific states, making it much easier to debug complex interactions.
When it comes to handling pseudo-classes or responsive breakpoints, standard developer tools can feel clunky. Hoverify makes this process effortless. Its Inspector lets you hover over elements to view and edit pseudo-classes in real time. This is a game-changer for productivity, especially when dealing with intricate layouts or animations.
For teams working on large-scale projects, Hoverify also offers collaborative perks. You can share state templates through version-controlled profiles, ensuring a consistent approach across team members - something traditional methods don’t typically support.
By consolidating tools and workflows into one cohesive environment, Hoverify reduces cognitive load. You no longer need to memorize different interfaces or juggle multiple tools. This unified experience is especially helpful when debugging layouts with complex CSS properties, responsive breakpoints, and interactive states.
Over time, the benefits add up. Hoverify’s ability to cut out constant tool-switching and provide instant visual feedback across devices means you’ll save hours during debugging sessions. It’s a smoother, faster way to tackle CSS challenges.
Get More Done with Hoverify: Tips and Best Practices
Hoverify offers a suite of features that can dramatically improve your workflow. By using it effectively, you can save time, avoid headaches, and tackle CSS issues before they escalate. Here’s how you can make the most of it.
Set Up Hoverify for Your Projects
The foundation of efficient CSS debugging with Hoverify lies in proper setup. One of the smartest moves is creating device profiles tailored to your audience. Instead of adjusting viewport sizes manually every time, set up custom profiles for your most common breakpoints. For instance, if your analytics reveal high mobile traffic from Safari on iOS, configure a profile that mirrors that environment.
You can create profiles for various devices - like desktop (1920x1080), tablet (768x1024), and mobile (375x667) - to test responsiveness across multiple screen sizes simultaneously. This way, you can quickly identify and fix issues that arise at different breakpoints.
If your project requires support for older devices or specific resolutions, save those configurations as reusable profiles. This ensures you won’t need to re-enter dimensions or settings during each debugging session.
Hoverify’s synchronized interactions make testing interactive elements a breeze. Actions like clicks or scrolls on one device preview are mirrored across others, allowing you to debug navigation menus, modals, and other interactive components with ease.
Once your environment is set up, you can document and share your findings effortlessly.
Save and Share Your Debugging Work
Hoverify’s screenshot tools are a game-changer for documentation. Whether you need to capture the visible viewport, the full page, a selected area, or a specific element, the tool has you covered.
For complex layout issues, the Select Element feature lets you isolate and capture only the problematic component. This keeps your screenshots clean and focused, making them ideal for bug reports or client presentations.
The built-in screenshot editor is another handy feature. You can annotate images to highlight specific problems, add text for clarity, or draw attention to areas needing fixes. This is especially useful when collaborating with team members or explaining issues to clients who may not be familiar with CSS jargon.
For sharing your work, Hoverify supports multiple export formats, including JPEG, PNG, WEBP, and PDF. PDFs are great for formal reports, while PNGs work well for quick updates or issue tracking. Full-page captures, in particular, are invaluable for showcasing how a layout adapts across different screen sizes, saving you the hassle of piecing together multiple screenshots.
With documentation sorted, you can turn your attention to refining your edits using Hoverify’s precision tools.
Use Measurement and Color Tools for Precise Debugging
Precision is everything in CSS debugging, and Hoverify’s tools make it easy to get things just right. The CSS Box feature visually breaks down padding, margins, borders, and dimensions, so you can instantly spot spacing issues without guesswork.
Need to check colors? The eyedropper tool quickly pulls RGB, CMYK, HSL, or hex values from anywhere on the page - even from images or iframes. This is perfect for ensuring your colors align with your project’s design guidelines.
Typography inconsistencies can be frustrating, but Hoverify’s Font Viewer helps you identify the exact fonts applied to elements. This is especially useful for troubleshooting font-loading issues or mismatched typography across sections of your site.
The Color Palette tool extracts every color used on the page, giving you a clear overview of your project’s color scheme. It’s a great way to ensure brand consistency or spot colors that feel out of place.
Hoverify also simplifies spacing adjustments with its visual CSS box model. You can see precise pixel values for margins, padding, and borders in real-time. For example, if a 20px margin is rendering as 18px due to collapsing margins or other quirks, the tool makes it immediately obvious.
Pair these tools with real-time style editing for a seamless debugging experience. Adjust spacing, colors, or typography and see the changes reflected instantly. This eliminates the trial-and-error approach, letting you fine-tune your designs efficiently.
Finally, Hoverify’s Search feature allows you to locate elements by tag names, IDs, classes, or CSS selectors. This is a lifesaver when working on large, complex layouts where finding specific elements manually would be tedious.
Conclusion: Make CSS Debugging Faster and Easier
Hoverify redefines how developers approach CSS debugging by addressing common frustrations with a smarter, more efficient workflow.
Debugging CSS doesn’t have to be a time-consuming, stressful process. With Hoverify, you get a suite of tools that simplifies your workflow - allowing you to inspect elements, test responsiveness, capture screenshots, extract assets, and edit in real-time, all without breaking your focus.
Its real-time editing feature is a game-changer. You can tweak CSS properties and test breakpoints with immediate feedback, cutting out the tedious save-refresh-check cycle. Tools like the eyedropper and CSS Box visualization take the guesswork out of fixing layout issues, ensuring precision and speed. By combining inspection, responsive testing, and live editing, Hoverify transforms traditional debugging into a seamless, modern experience.
For both solo developers and teams, Hoverify also keeps your debugging efforts organized. You can capture, annotate, and export findings, making it easy to document solutions and communicate effectively with colleagues or clients.
With over 22,000 developers relying on it and a 4.1/5 rating on the Chrome Web Store, Hoverify has proven itself as a trusted tool in real-world development. And at just $30 per year, it’s a cost-effective investment that saves countless hours of work.
Whether you’re dealing with responsive design headaches, color mismatches, typography adjustments, or tricky layout fixes, Hoverify equips you with everything you need to debug smarter and faster. It’s time to streamline your process and reclaim valuable development time.
FAQs
How does Hoverify’s hover-to-inspect feature make CSS debugging faster and easier?
Hoverify’s hover-to-inspect feature makes CSS debugging faster and easier by allowing you to inspect and edit elements simply by hovering over them. No more sifting through traditional developer tools - this feature saves you time and spares you the hassle.
Its real-time interface is designed to be intuitive, enabling you to spot and fix issues without breaking your workflow. Whether you’re fine-tuning designs or troubleshooting, it’s a handy tool for making quick, precise adjustments, so you can spend more time crafting great designs.
Can I use Hoverify’s live editing tools to make changes that work seamlessly across all major browsers?
Hoverify’s live editing tools are built to function smoothly with all major browsers, such as Chrome, Firefox, Edge, and other Chromium-based options like Brave. This compatibility ensures that any adjustments you make remain consistent across various platforms, streamlining your debugging process and saving you valuable time.
How can I create custom device profiles in Hoverify for better responsive design testing?
To set up custom device profiles in Hoverify, begin by accessing the responsive design mode. From the device dropdown menu, click on ‘Edit’, then choose ‘Add Custom Device’. You’ll need to input the device’s name, its dimensions, and any other relevant details. Once everything is filled out, hit ‘Save’.
This option allows you to test your designs on specific screen sizes and devices, helping you fine-tune and streamline your debugging process.