Browser DevTools just got smarter. In October 2025, Chrome DevTools 142 introduced new AI-powered tools, performance improvements, and resource management updates. Here’s what you need to know:
- Gemini AI Integration: Offers code suggestions, debugging help, and layout fixes directly in DevTools.
- Console Insights: Provides detailed error explanations and fixes in the Console panel.
- Performance Monitoring: Tracks Core Web Vitals (LCP, INP, CLS) and optimizes performance profiles.
- Resource Inspection: Improved Network panel for analyzing headers, timing data, and caching issues.
- Flexible Drawer Orientation: Allows side-by-side panel views for better multitasking.
These updates make debugging faster, error resolution easier, and performance optimization more precise. Enable AI features in DevTools Settings > AI Innovations to access Gemini AI, or use these tools directly in the latest Chrome version. Combine them with extensions like Hoverify for an even smoother workflow.
Gemini AI Integration in Chrome DevTools

Gemini AI brings a new level of functionality to Chrome DevTools by delivering context-aware debugging suggestions. Building on the updates introduced in October, it makes the development process smoother and more efficient.
AI-Powered Debugging and Code Assistance
Gemini AI works seamlessly across multiple panels in Chrome DevTools. It analyzes your code, network activity, and performance data to provide actionable recommendations, helping you save time and tackle issues more effectively.
Console Insights are at the heart of Gemini’s debugging features. When errors or warnings pop up in the console, the AI dives into network data, source code, and stack traces linked to those log messages. It provides clear explanations, actionable recommendations, and even a quick “TLDR” summary for faster understanding.
A standout addition is Gemini AI’s ability to compute layout metrics directly in the Elements panel. Its styling assistance takes CSS debugging to the next level by analyzing the page’s context. By examining the DOM, computed styles, and layout metrics, it identifies issues with layout, positioning, visibility, and the box model. Gemini can even suggest fixes and apply them directly by overriding styles in Chrome DevTools.
Network Analysis is made smarter with Gemini’s ability to inspect specific network requests. It reviews elements like request headers (sensitive details are redacted), response headers, status codes, and timing data to pinpoint issues causing failed requests. The AI also suggests ways to improve efficiency or generate detailed bug reports.
When it comes to performance, Gemini AI simplifies optimization with its performance monitoring tools. Developers can ask about recorded performance profiles or specific trace tasks, and the AI will break down the details, highlight areas needing attention, and propose strategies for improvement. For instance, it can help optimize metrics like the Largest Contentful Paint (LCP) and even generate labels for events in the Performance panel. Additionally, Gemini reviews source files to suggest logic improvements and provide code snippets.
How to Use Gemini AI Features
To make the most of Gemini AI in Chrome DevTools, ensure the feature is enabled in Settings > AI Innovations. Here’s how to access Gemini’s capabilities across different panels:
- In the Console panel, select an error to trigger Gemini’s analysis and receive detailed explanations.
- In the Network panel, choose a problematic request to review headers, status codes, and timing details with AI insights.
- In the Performance panel, examine recorded profiles for AI-highlighted areas needing optimization and suggested improvement strategies.
- In the Elements panel, inspect any element to access AI-driven analysis of computed styles and layout metrics.
New Debugging and Performance Monitoring Tools
The latest DevTools update for October introduces improved debugging and performance monitoring tools, making it easier to pinpoint issues and gain deeper insights into performance.
Console Insights for Easier Error Debugging
The Console Insights feature, powered by Gemini AI, simplifies error resolution by offering detailed explanations for errors and warnings directly within the Chrome DevTools Console. Instead of spending time deciphering error messages, you can hover over an error and select “Understand this error” for a breakdown. This AI-driven tool analyzes the error message, stack trace, source code, and network headers to provide specific insights.
If the explanation falls short, you can click the “Use search instead” option, which opens a new tab with related search results for further exploration. To access this feature, you’ll need the latest version of Chrome, be signed into your Google Account, have “English (US)” selected, and enable “AI Innovations” in DevTools Settings. Since this tool is still experimental, it’s important to verify the explanations and use any suggested code snippets carefully.
Performance Trace Debugging and Core Web Vitals Tracking
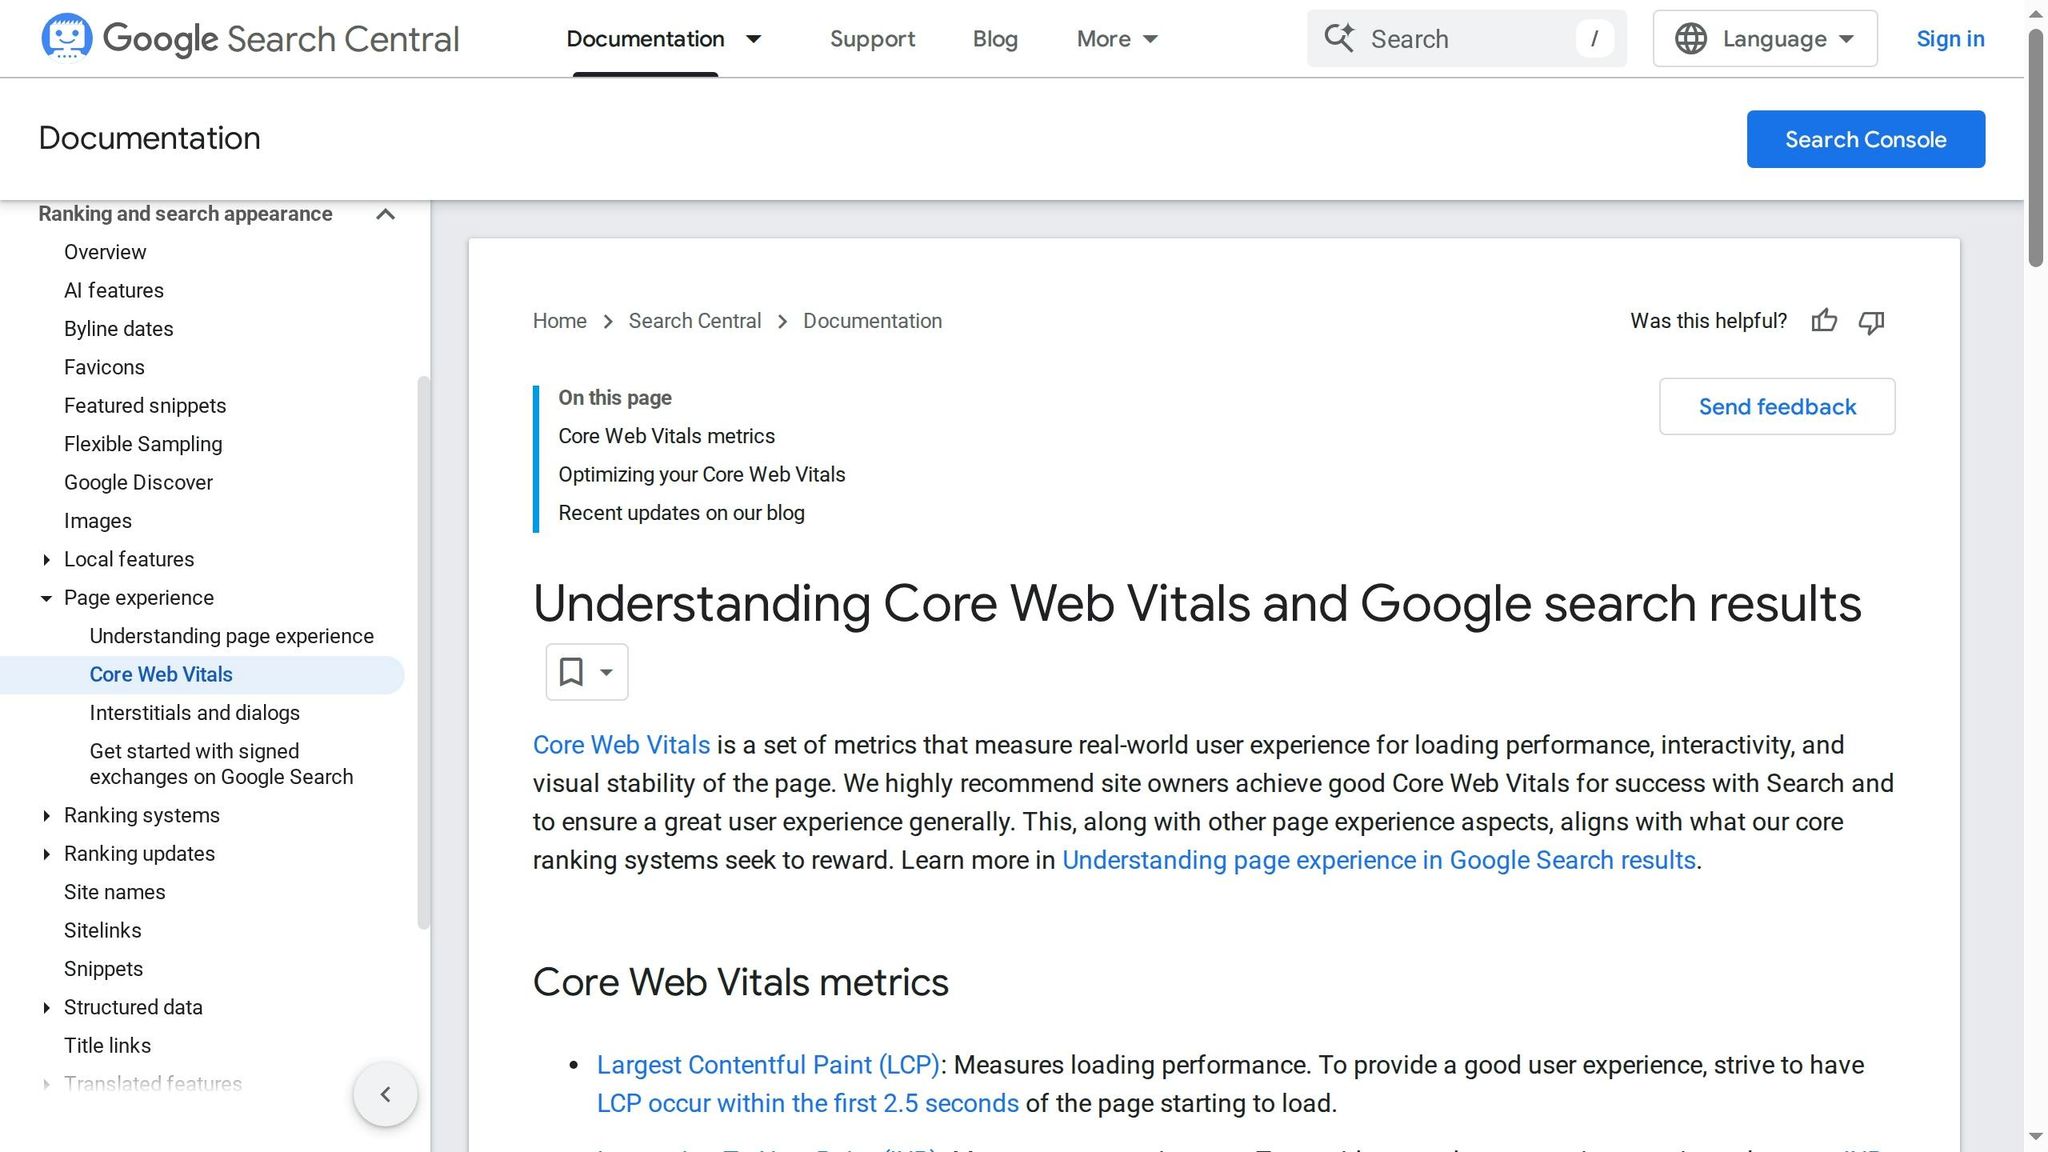
Beyond error debugging, the update enhances tools for performance optimization, helping developers address bottlenecks and monitor Core Web Vitals - LCP, INP, and CLS - directly in DevTools. The new performance trace debugging feature, integrated into the Performance panel, offers a detailed view of how your application behaves during critical interactions. With clear visualizations highlighting performance issues, these tools streamline the optimization process, enabling a smoother development workflow.
Note: INP (Interaction to Next Paint) replaced FID (First Input Delay) as a Core Web Vital in 2024, providing a more comprehensive measure of page interactivity by considering all interactions throughout the page lifecycle, not just the first one.
Resource Inspection and Caching Tool Updates
The October 2025 DevTools update brings a sharper focus on improving resource handling and caching. With advancements in performance and debugging, these updates make it easier to diagnose loading issues while enhancing overall performance.
Enhanced Resource Inspection Features
The revamped Network panel now provides a clearer view of response headers and timing data. This streamlined display helps you quickly pinpoint asset delivery problems, making troubleshooting faster and improving the performance of web applications.
Advanced Cache Management Tools
The updated cache management tools offer detailed insights into HTTP cache and service worker storage. These enhancements allow for more precise adjustments, helping to fine-tune performance effectively.
Hoverify Integration for Better Development Workflows
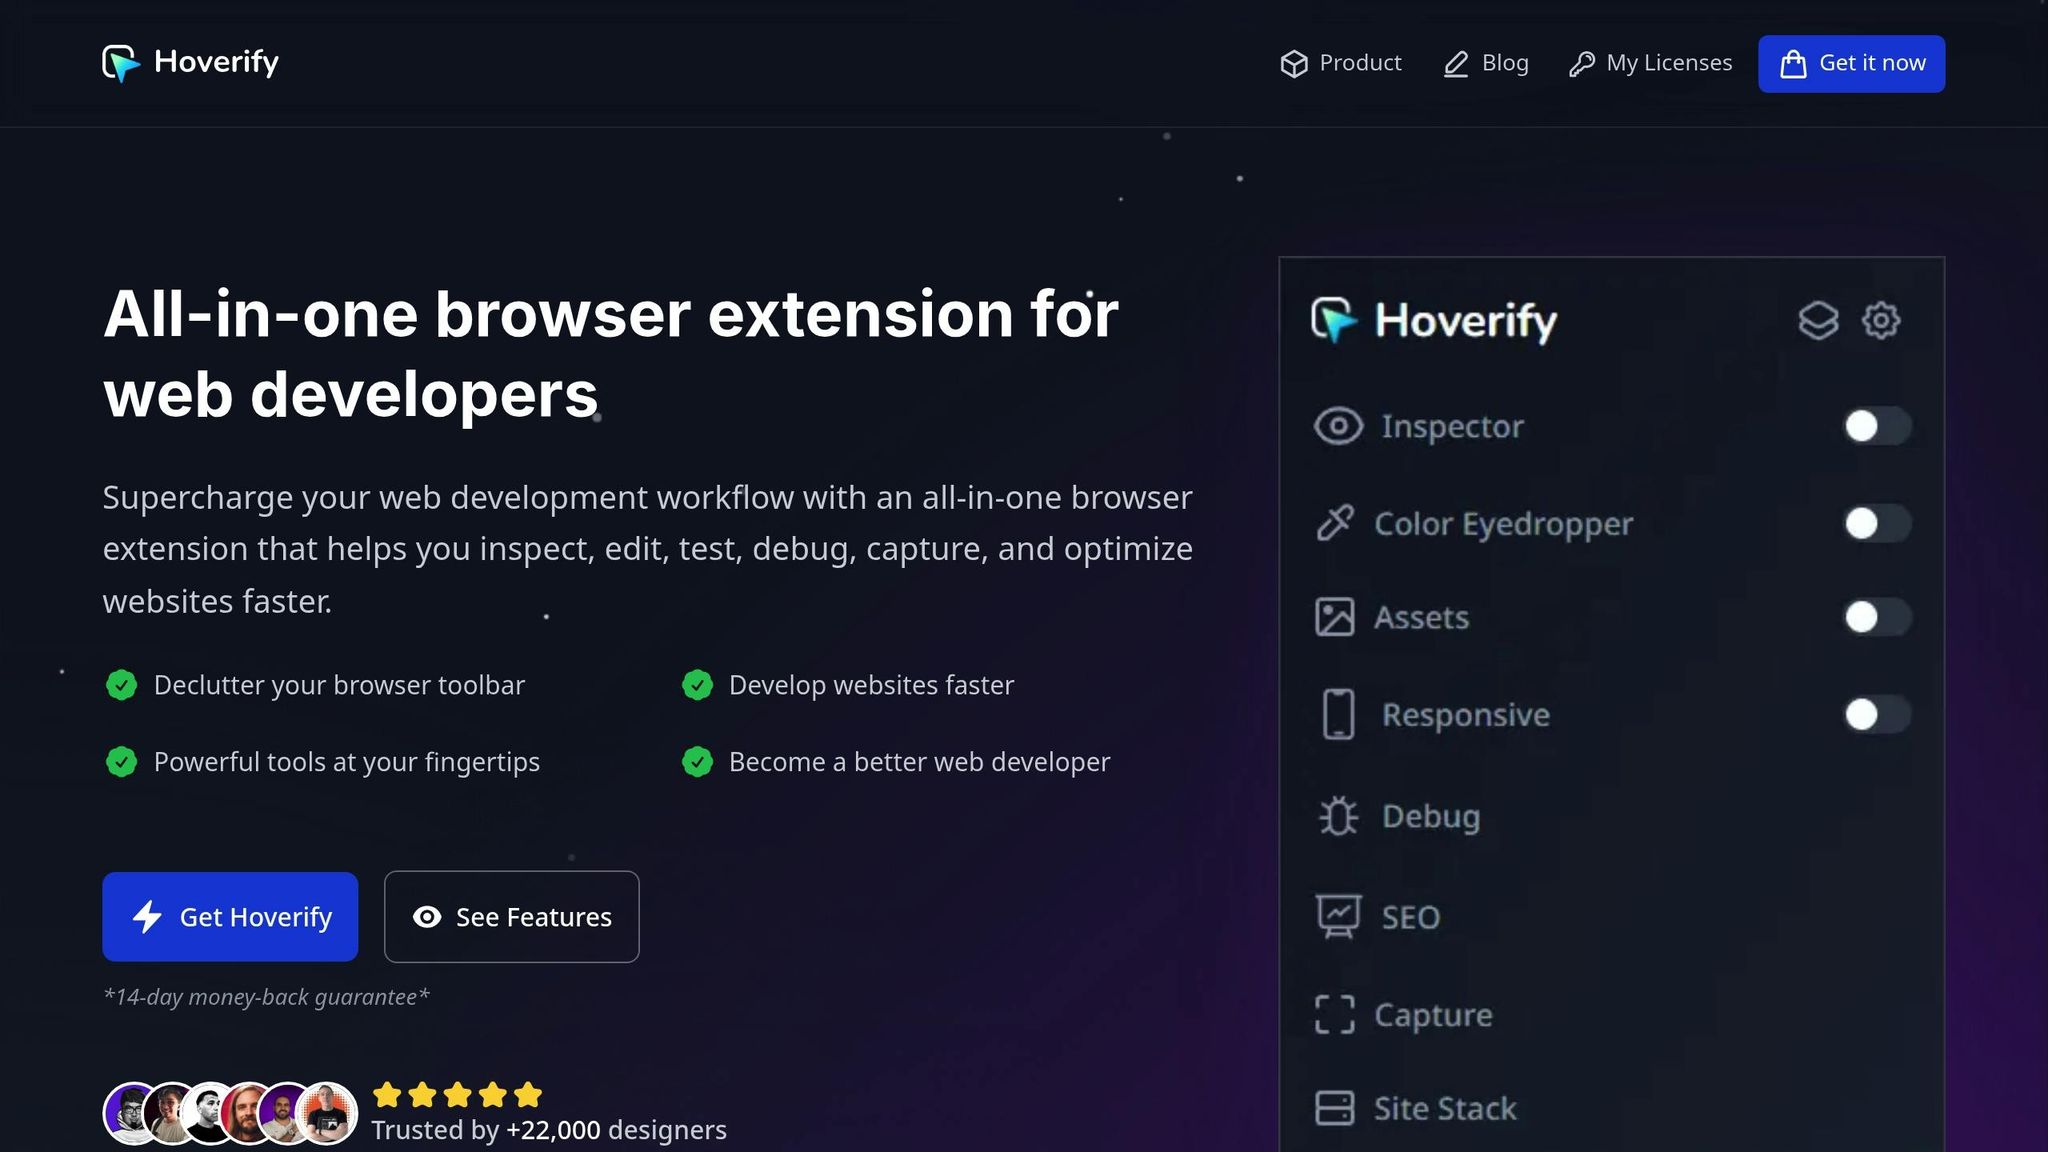
Hoverify takes development workflows to the next level by combining essential tools into a single, user-friendly interface. When paired with the latest debugging and performance updates, this integration simplifies tasks that often require juggling multiple utilities, saving time and effort.
A Full Suite of Development Tools
Hoverify offers a range of features designed to make development more efficient. For instance, the Inspector allows you to hover over elements to view their properties and edit styles in real-time - no need to dig through code manually. The Responsive Viewer lets you preview how a site looks across multiple devices simultaneously. Better yet, interactions like scrolling or clicking in one view automatically sync across all previews, making it easier to test responsiveness.
The Asset Extractor is another standout feature. It gathers all assets from a page - images, SVGs, videos, PDFs, even Lottie animations - and zips them for easy download. It even works with content inside iframes. Meanwhile, the Site Stack Analyzer provides a detailed breakdown of the technologies, hosting platforms, DNS records, and WordPress plugins powering any website.
The Visual Editor simplifies layout tweaks by offering an intuitive interface to modify margins, padding, and positioning, with changes applied instantly. You can also use the Custom Code Injection tool to add persistent HTML, CSS, or JavaScript for quick testing without needing to reload the page. For SEO, Hoverify’s Analyzer evaluates meta tags, header structures, and semantic HTML directly in your browser, making it easier to optimize your site on the go. These features go beyond traditional DevTools, offering convenience and speed that developers will appreciate.
Comparing DevTools and Hoverify
Knowing when to use DevTools versus Hoverify can help you work smarter. Here’s a quick comparison of how each handles common tasks:
| Task | DevTools Approach | Hoverify Approach | Key Advantage |
|---|---|---|---|
| Element Inspection | Right-click, then Inspect | Hover for instant details | Faster element identification |
| Style Editing | Elements panel, find element | Click element, edit visually | Real-time visual feedback |
| Responsive Testing | Toggle device toolbar | View multiple devices simultaneously | Synced actions for parallel testing |
| Asset Extraction | Network tab, save individually | One-click extraction | Bulk downloads in seconds |
| Color Picking | Limited to DevTools picker | Pick colors from anywhere | Works across iframes and media |
| Screenshot Capture | Browser screenshot, crop manually | Full page or element capture | Built-in editing and effects |
Hoverify complements DevTools by automating asset management and providing advanced technology analysis. Together, they create a seamless development environment that boosts productivity while retaining all the powerful debugging features introduced in the October 2025 updates.
Getting Started with These New Tools
The October 2025 update is now live in the latest version of Chrome. To explore Chrome’s Gemini AI integration, you’ll need to enable AI features in DevTools by going to Settings > AI Innovations. Meanwhile, the Console Insights and performance monitoring tools are ready to use right out of the box.
With these updates, debugging just got a whole lot smarter. If you encounter an error, head to the Console tab and try the AI-powered debugging assistant. It can break down error messages, suggest fixes, and even help fine-tune your code structure. This feature is especially handy for addressing JavaScript bugs and ironing out CSS layout problems.
The enhanced performance monitoring tools take workflow optimization to the next level. By enabling Core Web Vitals tracking in the Performance tab, you can monitor user experience metrics in real time. This is a game-changer for spotting performance issues early, particularly when testing on slower devices or under limited network conditions.
For those working on complex apps with numerous assets, the resource inspection improvements in the updated Network tab are invaluable. You’ll get detailed caching insights and resource timing data, making it easier to pinpoint and resolve slow-loading assets. These updates provide a clearer path to optimizing your app’s performance and integrating advanced tools seamlessly.
Pair these DevTools updates with Hoverify’s suite for a more streamlined debugging and visual testing experience. This combo creates a robust development environment that tackles multiple workflow challenges at once, aligning perfectly with the goal of boosting efficiency.
To ease into these updates without overwhelming your workflow, start small. Focus on one or two features that address your immediate challenges, master them, and then gradually explore the rest. This step-by-step approach ensures you build confidence while maintaining productivity.
A quick tip: Configure keyboard shortcuts under Settings > Shortcuts to speed up your workflow even more. When paired with these new tools, custom shortcuts can significantly enhance your debugging process, helping you work smarter and faster.
Note: Gemini AI is exclusive to Chrome.
FAQs
How does Gemini AI make debugging easier in Chrome DevTools?
Gemini AI makes debugging in Chrome DevTools easier by offering AI-powered code suggestions, instant bug detection, and practical performance insights. These tools allow developers to spot problems quickly and improve their workflow - all without stepping outside the DevTools environment.
By integrating Gemini AI, developers can debug more effectively, simplify testing processes, and boost web performance, making it a game-changer for today’s web development needs.
What are the main advantages of the new Performance Monitoring tools introduced in the October 2025 DevTools update?
The October 2025 DevTools update introduces a set of Performance Monitoring tools that bring practical advantages to web developers:
- Pinpoint performance issues such as oversized DOM trees, allowing you to clean up your code and improve page load speeds.
- Exclude third-party scripts to concentrate on your own code, making debugging quicker and more precise.
- Test under realistic conditions with adjustable CPU throttling, offering dependable insights into performance.
- Spot layout thrashing (forced reflow) to fine-tune rendering and deliver smoother user interactions.
These features aim to cut down on time spent troubleshooting, eliminate unnecessary guesswork, and boost overall productivity in your workflow.
How can developers use Hoverify with the latest Chrome DevTools updates to boost their workflow?
Developers can enhance their workflow by integrating Hoverify with the latest updates in Chrome DevTools. Hoverify’s powerful tools for automation and debugging help cut down on repetitive tasks, making daily development smoother and more efficient. For example, its scripting features can automate routine workflows, while the performance metrics in the new DevTools - like DOM size optimizations and AI-driven suggestions - offer valuable insights for fine-tuning your projects.
The tool also works seamlessly with updates like the redesigned Performance Panel, enabling quicker issue identification and resolution. This synergy leads to faster debugging, easier testing, and optimized performance, all while staying in step with the latest Chrome DevTools advancements.