Debugging JavaScript in Chrome DevTools is easier than you think. Whether you’re fixing bugs, analyzing performance, or optimizing your code, Chrome DevTools provides powerful tools like breakpoints, source maps, and live expressions. This guide covers how to open and configure DevTools, then works up from console debugging to conditional breakpoints and the Network and Performance panels. Tools like Hoverify complement DevTools with quick inspection and productivity-focused features, so pairing the two streamlines your workflow.
Debugging JavaScript in Chrome DevTools
How to Start Using Chrome DevTools
Chrome DevTools offers a range of debugging tools directly in your browser. Whether you’re using Windows, macOS, or Linux, it’s simple to get started.
How to Open Chrome DevTools
You can open Chrome DevTools using these shortcuts: CTRL+SHIFT+I for Windows/Linux or CMD+OPT+I on macOS. Another way is to right-click any element on a webpage and choose “Inspect”. If you want direct access to the console, use CTRL+SHIFT+C (Windows/Linux) or CMD+OPT+C (macOS).
Adjusting DevTools and Activating Advanced Options
To customize your DevTools, click the three-dot menu in the top-right corner of the DevTools interface. For debugging JavaScript, enable source maps by navigating to Settings > Preferences > Sources. This maps minified code back to its original files, making it easier to work with. You can also turn on experimental features like live expressions, which let you track values in real time. Setting up workspaces allows you to save changes directly to your local files during debugging.
Once you’ve tailored DevTools to your needs, you’ll be equipped to dive into advanced debugging and improve your development workflow.
Key Debugging Techniques in Chrome DevTools
Chrome DevTools offers a range of tools to help developers quickly identify and resolve JavaScript issues. Here are some of the most useful debugging techniques to streamline your workflow.
Inspecting and Editing Elements
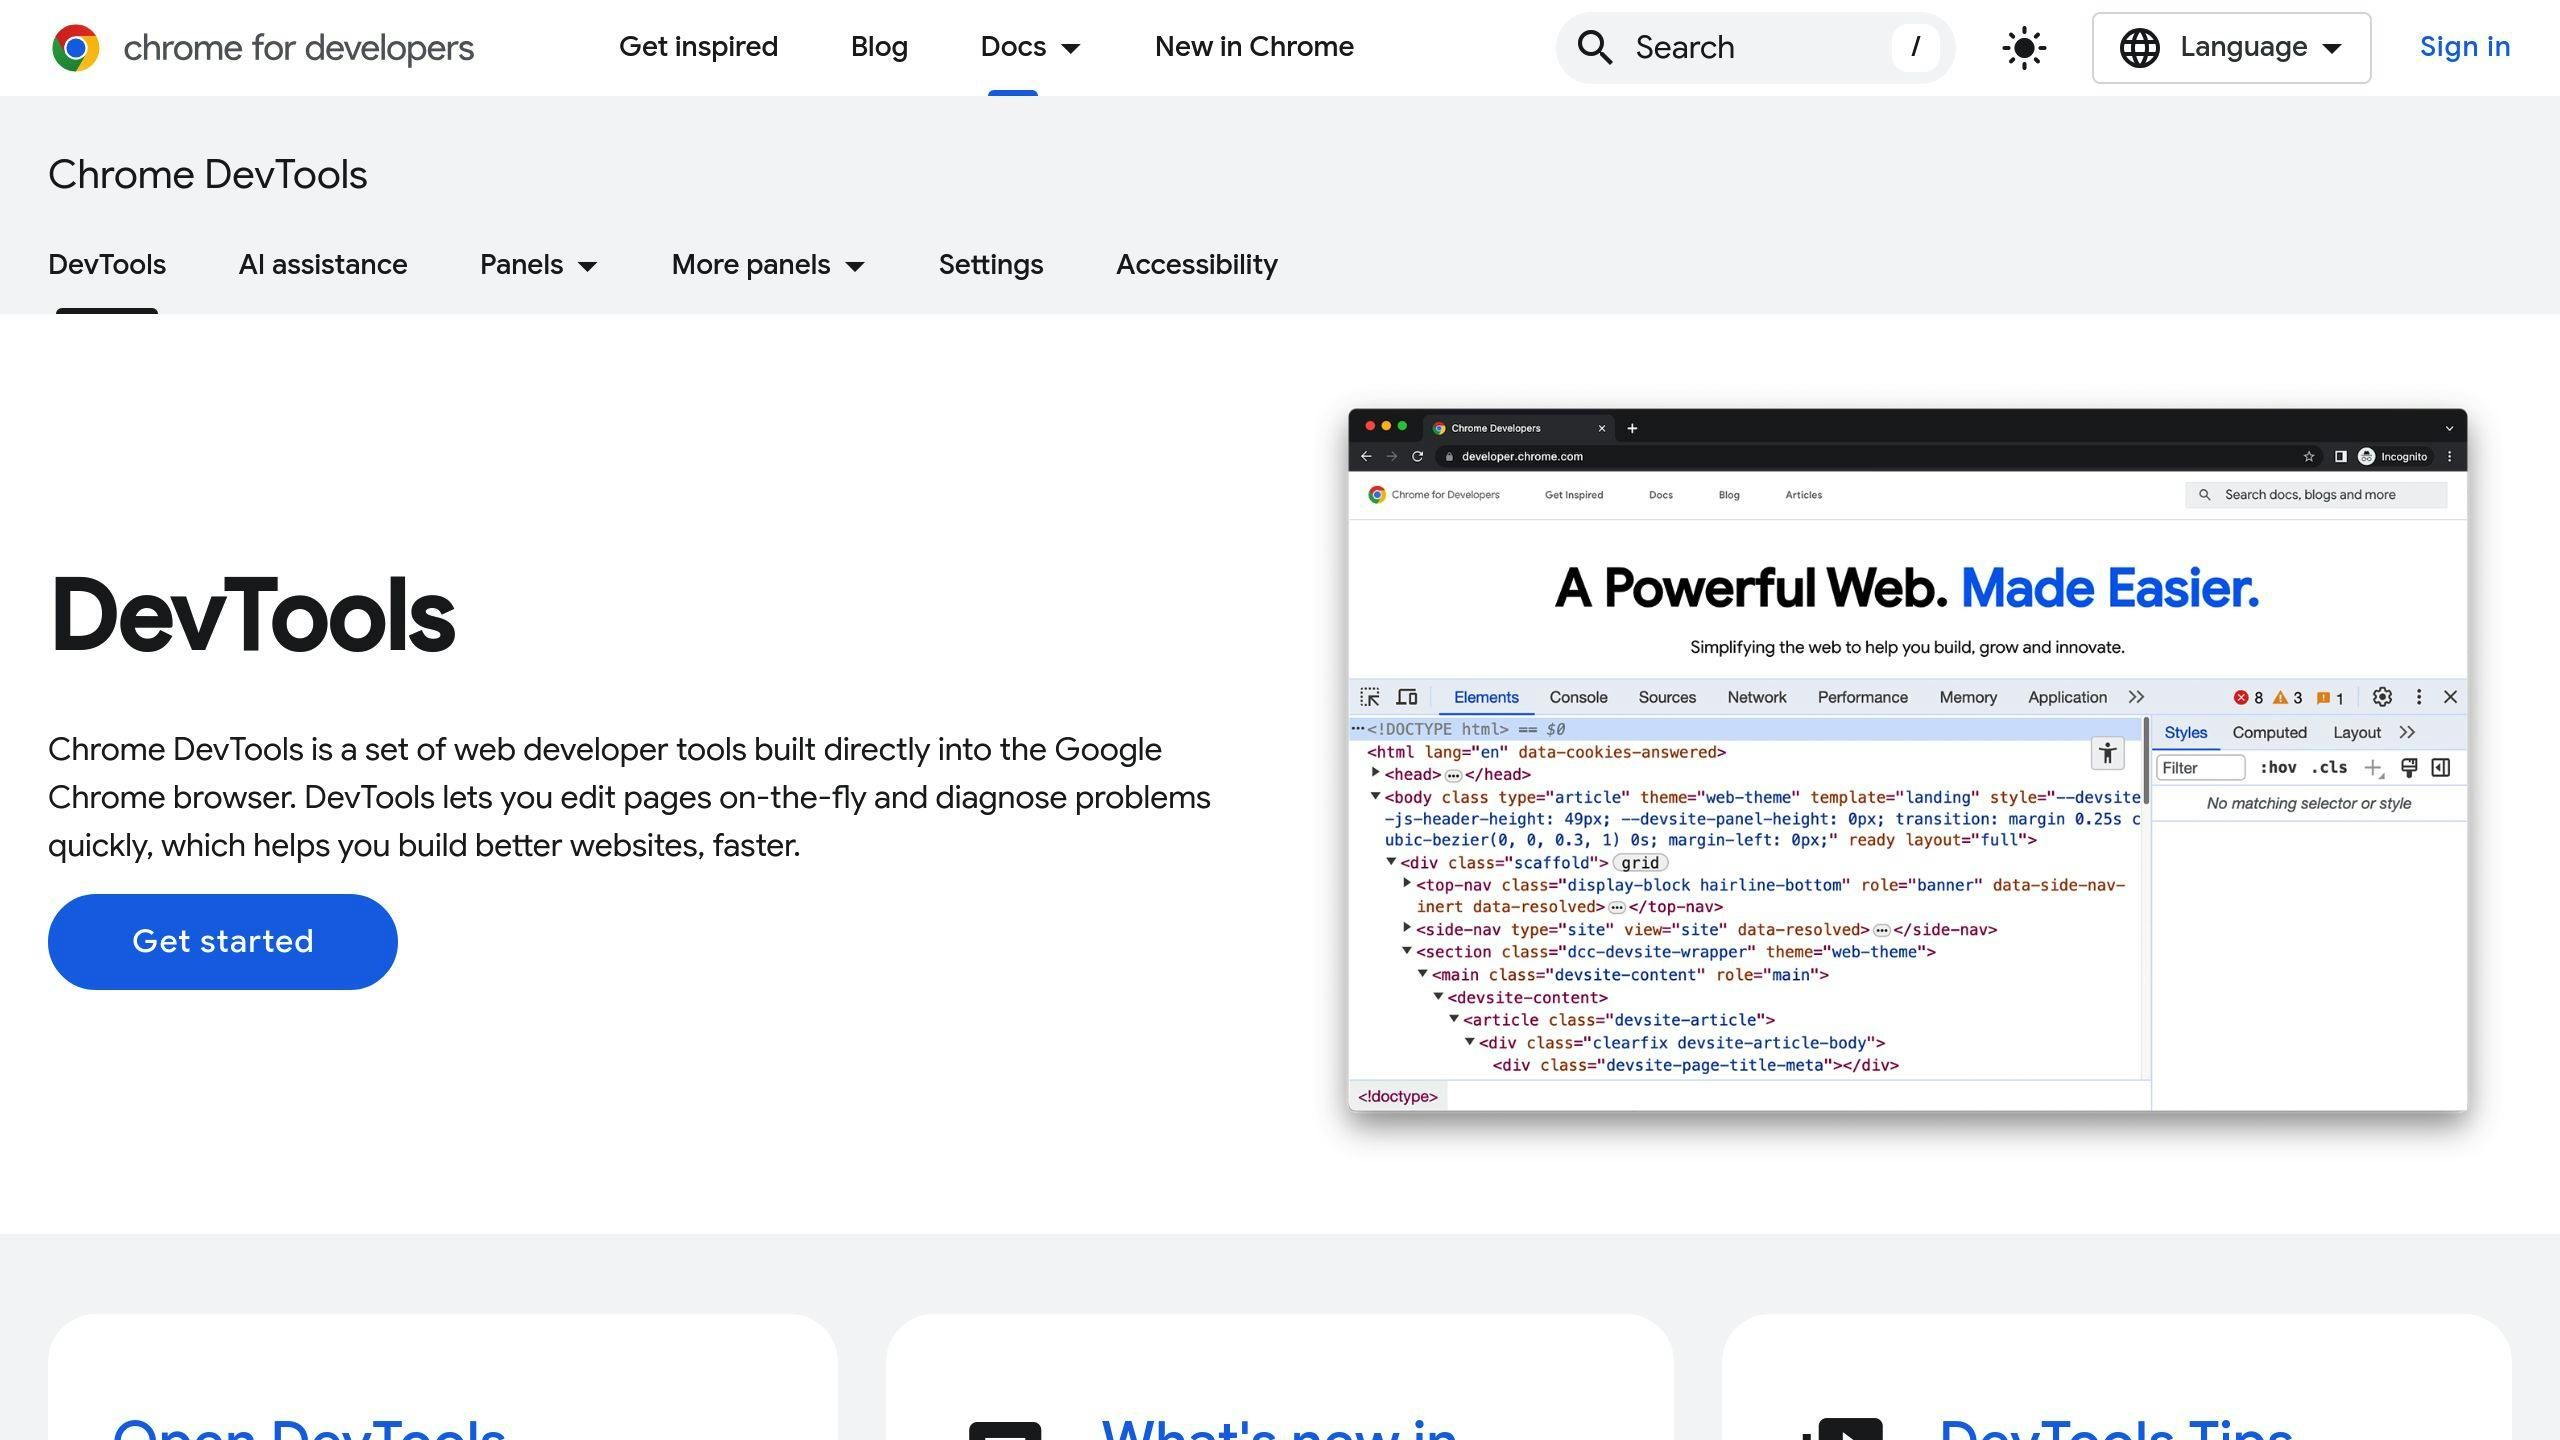
The Elements panel lets you examine and modify the DOM and CSS in real time. You can access it using Command + Option + C on Mac or CTRL + Shift + C on Windows/Linux. Some key features include:
- Viewing and editing DOM elements and CSS styles live
- Running JavaScript directly on selected elements
- Debugging event listeners and DOM-related interactions
While the Elements panel focuses on the DOM, the Console is your go-to for JavaScript insights.
Using the Console for Debugging
The Console panel is perfect for quick troubleshooting and testing. Here are some handy debugging techniques:
console.log('Variable value:', variableName);
console.table(arrayOrObject);
You can also use debug() to track function calls and monitorEvents() to observe DOM events. These tools provide instant feedback and help you pinpoint issues.
For a deeper dive into your code, check out the Sources panel, which allows you to directly inspect and modify JavaScript files.
Debugging JavaScript Source Files
The Sources panel is a powerful tool for debugging JavaScript. It includes features like:
- Mapping local files to network resources for direct editing
- Debugging bundled or transpiled files using source maps
- Analyzing function execution with the Call Stack pane
These capabilities make it easier to trace and resolve complex issues in your code.
Tracking Values with Live Expressions
Live expressions let you monitor variables in real time, offering another way to debug alongside breakpoints and console logs. To set one up:
- Click the “Create Live Expression” button (eye icon)
- Enter your desired expression
- Watch as it updates in real time during code execution
For even more precision, pair live expressions with conditional breakpoints to focus on specific scenarios. You can also use the blackboxing feature to exclude third-party code from your debugging process, keeping your focus on what matters.
Advanced Tools for Debugging in Chrome DevTools
Once you’ve mastered the basics, Chrome DevTools offers tools to handle more complex debugging challenges. Here’s how you can make the most of these advanced features.
Using Breakpoints for Debugging
In the Sources panel, you can set conditional breakpoints to pause code execution only when certain conditions are met. Right-click a line number, select ‘Add conditional breakpoint,’ and define the condition. This is especially useful for diagnosing tricky issues in your code.
// Example of a conditional breakpoint
if (userCount > 1000) {
    processUsers(); // Set breakpoint with condition: userCount === 1500
}
Debugging Network and Performance Issues
The Network panel is your go-to tool for analyzing API calls and resource loading. It helps you examine:
- Request headers and timing
- Resource loading patterns
- CORS errors
- Failed API calls
For performance-related issues, the Performance panel is invaluable. Use it to identify bottlenecks in CPU, memory, or network usage. Key metrics to monitor include:
| Metric | What It Helps Diagnose |
|---|---|
| CPU Usage | Slow or inefficient scripts |
| Memory Allocation | Potential memory leaks |
| Network Activity | Inefficient resource loading |
Debugging Security Issues
The Security panel is designed to uncover vulnerabilities like certificate errors or mixed content warnings. Use it to:
- Verify certificate validation
- Check CORS configurations
- Identify security-related console errors
For a thorough approach, pair the Console and Security panels. Together, they provide a clearer picture of vulnerabilities and how to address them effectively.
Conclusion: Mastering JavaScript Debugging with Chrome DevTools
Chrome DevTools offers developers a powerful suite of tools for inspecting, debugging, and analyzing performance in real-time. By using features like source maps, you can debug your original code even when working with transpiled or minified JavaScript. This is especially useful for working with modern frameworks and build tools.
What to Do Next
Here’s how you can build your debugging skills:
-
Start with the Basics: Use the Console panel for simple debugging tasks. Get comfortable with tools like
console.log(), breakpoints, and the step-through debugger. Start with smaller projects to build confidence before tackling more complex applications. -
Explore Advanced Features: Once you’ve mastered the basics, dive into advanced tools. Learn how to use blackboxing to hide unnecessary scripts, performance profiling to fine-tune resource usage, and source maps to work with original code.
-
Streamline Your Workflow: Chrome DevTools is robust, but pairing it with tools like Hoverify can improve productivity. This combination lets you handle both in-depth debugging and everyday development tasks with ease.