Most GEO statistics posts recycle each other. A number gets published, quoted without its method, rounded on the way, and six months later it is a fact everyone knows and nobody can source.
So this page has one rule: every figure is either something we measured ourselves, with the method written down, or a link to the people who did. Where two credible sources disagree, both are here. Disclosure: Hoverify is our product and its GEO checker uses the same probe logic as the original research below.
Original research: what 95 sites actually ship
On 1 September 2026 we probed 95 well-known domains across 6 categories for the things a generative engine actually consumes. 84 responded. The 11 that did not are excluded from every percentage below, and named at the end.
| Measure | Share of the 84 reachable sites |
|---|---|
| Have a robots.txt | 93% |
| Have JSON-LD on the homepage | 58% |
| Serve a valid /llms.txt | 36% |
| Serve /llms-full.txt | 12% |
| Advertise a Markdown alternate | 7% |
| Return HTML for /llms.txt, having no real file | 5% |
The median text-to-HTML ratio was 2.4%, with a range from 0.2% to 22.3%. The typical prominent homepage is about 97% markup and script by weight. That single number explains more about AI retrieval than most of the advice written about it.
Adoption splits almost entirely by category
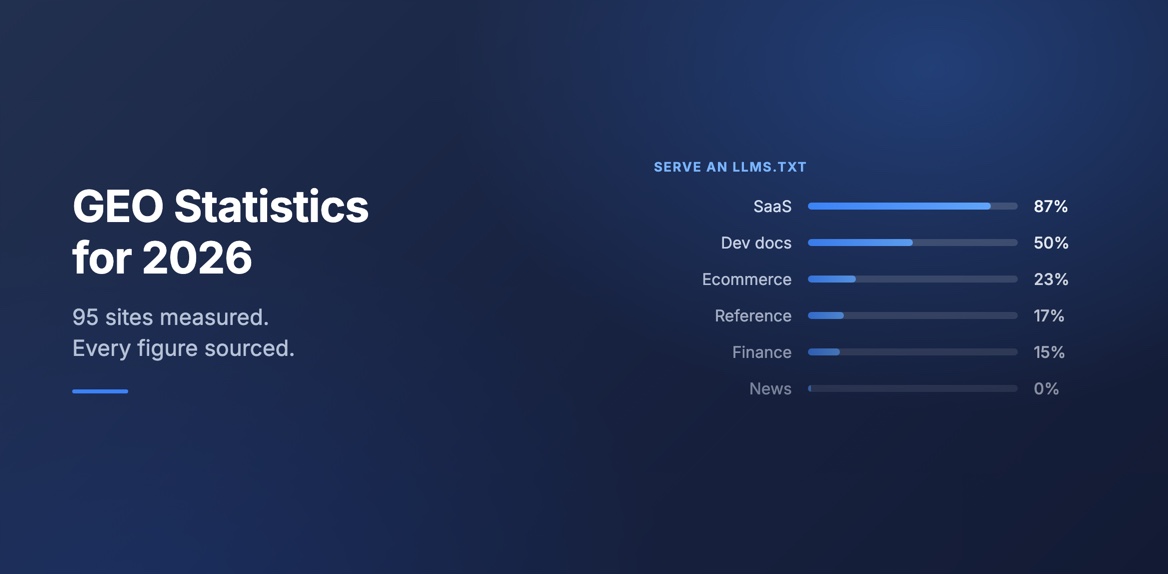
The overall 36% hides the real finding. Grouped, llms.txt adoption looks like this:
| Category | Sites measured | Serve llms.txt | Homepage JSON-LD | Median text ratio |
|---|---|---|---|---|
| SaaS and tools | 15 | 87% | 73% | 1.6% |
| Developer docs | 20 | 50% | 20% | 3.2% |
| Ecommerce | 13 | 23% | 77% | 1.2% |
| Reference and education | 12 | 17% | 50% | 5.3% |
| Finance and health | 13 | 15% | 77% | 2.6% |
| News and media | 11 | 0% | 73% | 2.2% |
Not one news site in the sample served an llms.txt. Not one served a Markdown alternate either. This is the category AI answers lean on most heavily for current events, and its adoption of the conventions marketed as essential is zero.
The inverse also holds. SaaS marketing sites, at 87%, have adopted it fastest, and they are not usually what an AI answer needs to cite. Adoption tracks who reads AI-search marketing, not who gets cited.
Sites block the crawlers that would cite them
Of the 78 sites with a robots.txt, here is how many block each crawler at the root. The distinction matters: retrieval crawlers fetch pages to answer a question being asked right now, so blocking them costs citations. Training crawlers feed model training, and blocking them does not affect whether you get cited.
| Crawler | Purpose | Blocked by |
|---|---|---|
| CCBot | Training | 24% |
| ClaudeBot | Training | 22% |
| Google-Extended | Training and grounding | 18% |
| PerplexityBot | Retrieval | 17% |
| anthropic-ai | Training | 17% |
| GPTBot | Training | 13% |
| ChatGPT-User | Retrieval | 10% |
| Claude-SearchBot | Retrieval | 9% |
| OAI-SearchBot | Retrieval | 6% |
The broad shape is rational: training crawlers get blocked roughly twice as often as retrieval crawlers. But 17% blocking PerplexityBot is a real number, and some of those sites are blocking the fetch that would have quoted them. If you have opinions about AI training, the useful move is to block the training crawlers by name and leave the retrieval ones alone, which most of this sample has worked out.
A quieter finding: 11 of 95 sites, about 12%, refused a plain scripted request from a browser user agent altogether. Four of those are major news organizations. Bot mitigation does not distinguish between us and an AI crawler as cleanly as anyone would like.
5% have a file that is not there
Four sites returned HTTP 200 and a page of HTML for /llms.txt: Ars Technica, ASOS, Khan Academy and Mayo Clinic. There is no file. Their app answers every unmatched path with the app shell, so any checker trusting the status code will report success. If you have ever been told you have an llms.txt and never written one, this is why.
What AI search did to clicks
The click-loss numbers are the best-evidenced statistics in this whole subject.
Pew Research tracked 900 US adults through 68,879 Google searches in March 2025, of which 12,593 produced an AI summary:
- Users clicked a traditional result on 8% of visits where an AI summary appeared, against 15% where none did.
- 1% of visits to a page with an AI summary produced a click on a source cited inside it.
- Browsing sessions ended after 26% of pages with an AI summary, against 16% without.
- 18% of searches in the study produced an AI summary at all.
- The median summary was 67 words, and 88% cited 3 or more sources.
That last pair is the GEO problem stated numerically. The prize is being one of about 3 sources in a 67-word answer, and being cited buys you a 1% chance of a visit.
SparkToro, working from Similarweb clickstream data, put US zero-click searches at 68.01% across the first 4 months of 2026, up from 60.45% in 2024. Per 1,000 searches, 276 visitors now reach a website, against 374 two years earlier. Their post blocks our fetches, so that figure is taken from Search Engine Land’s report of it rather than read on the page.
What actually moves citations
The founding GEO paper built a 10,000-query benchmark and rewrote source pages 9 ways. Scored on position-adjusted word count against an unoptimized baseline of 19.5:
| Rewrite | Score |
|---|---|
| Adding quotations | 27.8 |
| Adding statistics | 25.9 |
| Adding citations | 24.9 |
| Adding unique words | 20.7 |
| Baseline, unchanged | 19.5 |
| Keyword stuffing | 17.8 |
Keyword stuffing measured worse than doing nothing.
The number to hold that against comes from a critical survey of 45 studies published in July 2026: those gains are conditional on the page already being retrieved, and no reviewed technique showed a stable cross-platform effect on organic discoverability. One benchmark, one caveat, and the caveat is the larger of the two.
AI search statistics on llms.txt
Two credible measurements of llms.txt adoption disagree, and the disagreement is the interesting part.
SE Ranking checked 300,000 domains in November 2025 and found 10.13% carrying the file, with no relationship to how often a domain was cited in AI answers. Dropping llms.txt from their prediction model made the model more accurate.
We found 36% across 84 sites on 1 September 2026.
Both are right. Theirs is a large, broad sample of the web; ours is 84 prominent sites picked to compare categories. Prominent sites adopt conventions faster than the web at large, which is exactly what the gap measures. Use the 10% figure when you mean “the web” and ours when you mean “well-known sites in these categories”, and never quote either without its sample.
Meanwhile Google’s guidance, updated 10 July 2026, is that Search ignores the file entirely and maintaining one will neither help nor harm your rankings.
How to read these generative engine optimization statistics
Four cautions, because a statistics page without them is decoration.
Our sample is curated, not random. 95 domains chosen to compare categories is not a survey of the web, and category groups of 11 to 20 sites carry wide error bars. Treat the category ordering as real and the exact percentages as approximate.
Excluding unreachable sites biases the result. The 11 we could not fetch skew toward news and paywalled publishers, so figures like “0% of news sites” describe the 11 news sites that answered us.
Anything measured against a generative engine is unstable. Ask the same question twice and the sources change, which is why this page measures what sites ship rather than what models say.
And most of these numbers describe adoption, not effect. That 36% of sites ship an llms.txt is a fact about publishers. It says nothing about whether the file works, and the best available evidence says it does not do much.
Method, and using these numbers
The probe requested /, /robots.txt, /llms.txt and /llms-full.txt from each domain on 1 September 2026 from a US IP with a desktop browser user agent, following redirects. A crawler file counts only if the response is not HTML, which is what separates a real file from an app catch-all. Structured data means at least one application/ld+json block in the homepage response. The text ratio is extracted text length over raw HTML length after removing script and style blocks. Robots verdicts come from matching each bot to its most specific user-agent group and checking for a root disallow.
The 11 unreachable domains: AP News, Reuters, Bloomberg, The Economist, Etsy, eBay, Stack Overflow, Britannica, ScienceDirect, GoodRx and NIH.
Quote any of this with a link back and the date. The figures are a snapshot of 1 September 2026 and this category moves monthly, so if you are reading this much later, treat the numbers as history and re-run the measurement yourself.