Website performance analysis helps you identify and fix issues that affect how fast and efficiently your site loads. This process isn’t just about speed - it’s about understanding your site’s technical setup, from server response times to how resources like images and JavaScript load. The work breaks down into a few stages: track Core Web Vitals (LCP, FID, CLS), run a baseline audit with tools like Lighthouse, GTmetrix, and WebPageTest, fix the high-priority issues first (large images, slow server responses, render-blocking resources), then keep monitoring so regressions don’t creep back in. Hoverify covers much of the inspection and testing side from a single extension.
Faster websites improve user satisfaction, boost search rankings, and increase conversions. Regular audits and proactive fixes ensure your site stays optimized for all users.
Tools for Performance Stack Analysis
Once you’ve got a handle on key metrics, the next step is choosing the right tools for a deep dive into performance analysis. To identify bottlenecks and areas for improvement, you’ll need specialized software. Fortunately, there are plenty of options available, from free browser-based tools to advanced monitoring platforms.
Main Tools for Performance Auditing
For precise performance measurements, here are some standout tools to consider:
Lighthouse is integrated directly into Chrome DevTools and is one of the most popular tools for performance auditing. It generates detailed reports on performance, accessibility, SEO, and best practices. Lighthouse also evaluates Core Web Vitals and provides actionable recommendations tailored to your site. With automated testing and scores ranging from 0 to 100, it’s easy to track your progress over time.
GTmetrix is another excellent option, offering both free and premium versions. It specializes in waterfall analysis, which visually breaks down how resources load and pinpoints delays. GTmetrix also tracks trends over time, giving you historical data to monitor performance across different devices and locations.
WebPageTest is an open-source tool that provides advanced features like connection throttling, custom scripting, and multi-step testing scenarios. Its filmstrip view visually captures how a page loads, while detailed waterfall charts show the timing of every network request. You can test from various global locations and device setups, making it a highly versatile option.
Each of these tools brings a unique strength: Lighthouse provides quick and clear audits, GTmetrix excels at trend tracking and waterfall insights, and WebPageTest offers granular, technical-level data.
How Hoverify Helps with Performance Analysis
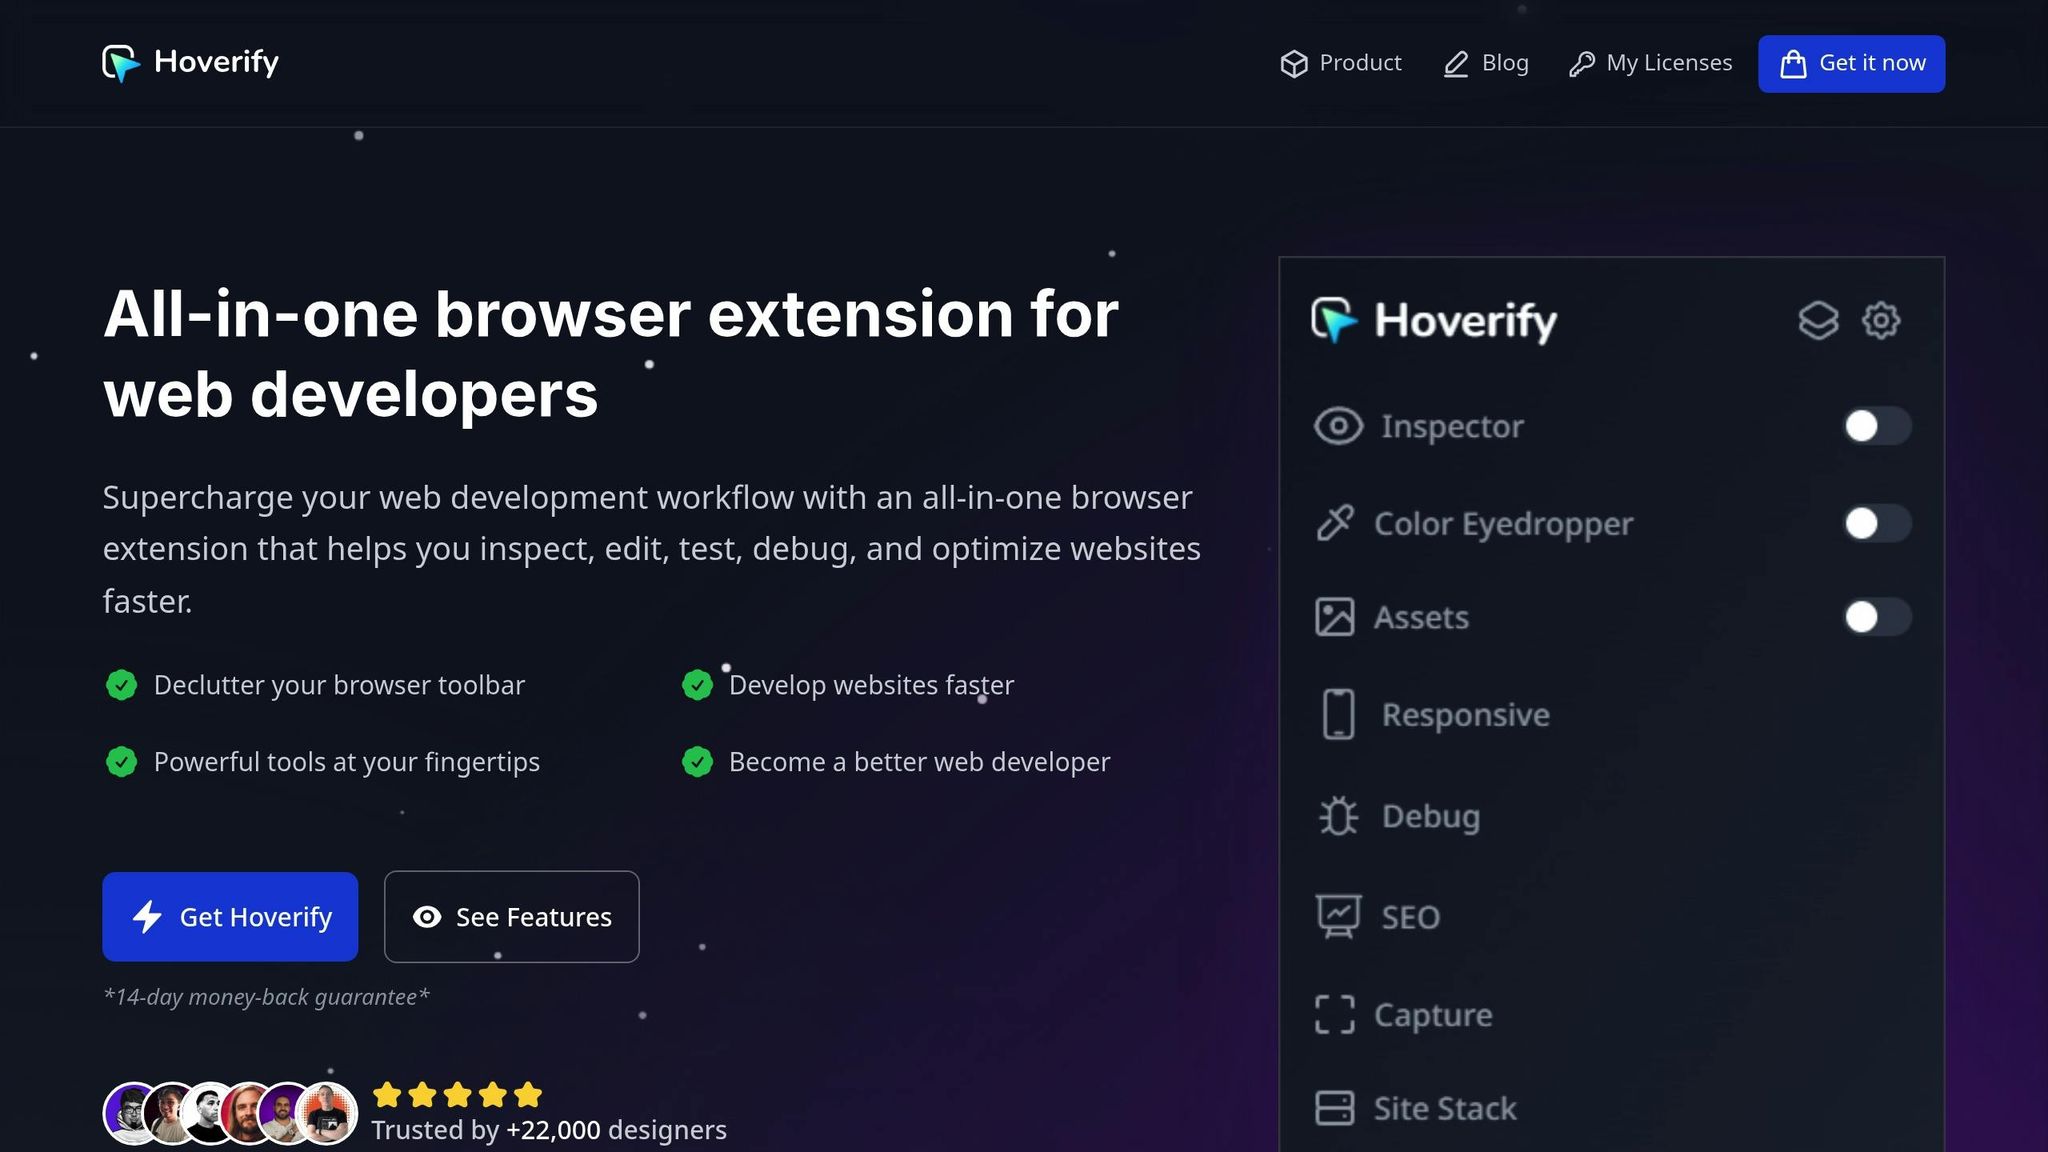
Hoverify simplifies performance analysis with a suite of modules, each designed to tackle specific aspects of website evaluation.
- The Inspector module highlights how individual elements impact performance, such as CSS rendering delays or layout shifts. It’s a real-time tool that eliminates the need to jump between multiple platforms.
- With the Site Stack module, you can instantly identify the technologies behind a website - frameworks, hosting providers, DNS, SSL details, and content delivery networks. The whole analysis exports as a PDF, or as Markdown, JSON or CSV, which is handy when the audit is going to a client rather than staying in your head.
- The Responsive Viewer tests performance across desktop, tablet, and mobile devices simultaneously. This synchronized testing approach saves time and reveals device-specific performance issues.
- The Assets module organizes all page resources, allowing you to spot oversized images, unoptimized videos, or unnecessary files. It displays file sizes and formats, and even lets you bulk download resources for further analysis.
- The Debug feature enables real-time testing of custom CSS and JavaScript changes. You can experiment with optimization techniques and immediately see their effects without altering the live site.
Hoverify’s tools work together to provide a streamlined, comprehensive approach to performance analysis.
Monitoring Tools for Ongoing Performance Tracking
While audit tools capture a snapshot of your website’s performance, monitoring tools keep an eye on it over time. These tools ensure you’re alerted to issues as they arise and allow you to track trends.
- Uptrends monitors website performance from multiple global locations. It sends real-time alerts when performance dips below your set thresholds.
- Pingdom focuses on uptime monitoring but also tracks page load times and performance metrics. Alerts via email, SMS, or webhook ensure you can act quickly when problems occur. Its reports help identify long-term patterns, including seasonal trends.
- New Relic goes deeper with application performance monitoring, tracking server response times, database queries, and application-level metrics. This tool is particularly useful for identifying backend issues that frontend tests might miss.
Key Performance Metrics and How to Read Them
Performance metrics give you a clear picture of how your website loads and responds to user actions. Each one highlights specific aspects of site behavior, from delays to overall user experience. The trick is understanding which numbers matter the most and what they reveal about your site.
Core Web Vitals Explained
Google’s Core Web Vitals focus on user experience and can directly impact your search rankings. These three metrics highlight the factors that make a website feel quick and responsive.
Largest Contentful Paint (LCP) tracks how long it takes for the largest visible element on a page to fully load. Ideally, LCP should be under 2.5 seconds, while anything over 4.0 seconds could be a problem. Common causes of high LCP include oversized images, slow server responses, or resources that block rendering. To improve this metric, start by optimizing large images and reviewing critical resources.
First Input Delay (FID) measures the time between a user’s first interaction (like clicking a button) and when the browser starts responding. An FID below 100 milliseconds is great, but anything above 300 milliseconds signals sluggish performance. Heavy JavaScript processing is often the culprit behind high FID.
Cumulative Layout Shift (CLS) evaluates how stable the visuals on a page are during load. A CLS score under 0.1 is ideal, while scores over 0.25 lead to frustrating user experiences as elements shift unexpectedly. Issues like images without set dimensions, web fonts causing text reflows, or late-loading ads often contribute to high CLS.
Other Important Metrics to Track
Beyond Core Web Vitals, other metrics can provide a broader view of your site’s performance:
- Time to First Byte (TTFB): This measures how quickly your server starts sending data after a request. A TTFB under 200 milliseconds is ideal, while anything over 600 milliseconds could signal hosting or server-side issues.
- Total Blocking Time (TBT): Tracks how long the main thread is blocked, preventing user interactions. Lower TBT values mean a more responsive page, while higher values often point to heavy JavaScript or multiple third-party scripts.
- Speed Index and Resource Load Times: These help identify delays caused by unoptimized assets, giving you a clearer view of bottlenecks.
Step-by-Step Performance Stack Analysis
Analyzing your website’s performance step by step ensures you address potential issues before they disrupt user experience. This structured approach not only helps you identify bottlenecks but also provides a clear path for optimization.
First Audit and Data Collection
Start by conducting a baseline audit to gather key metrics that will serve as benchmarks for your improvements.
- Run a Lighthouse audit using Chrome DevTools to capture essential Core Web Vitals metrics like Largest Contentful Paint (LCP), First Input Delay (FID), and Cumulative Layout Shift (CLS). Note any flagged issues.
- Use Hoverify’s Inspector to examine individual elements for performance impact. Look for render-blocking resources, oversized images, or layout shifts that may slow down your page.
- Leverage Hoverify’s Site Stack module to analyze the technologies powering your site. This can reveal optimization opportunities, such as upgrading to faster hosting or eliminating unnecessary plugins.
Document baseline metrics, including Core Web Vitals, total page size, number of requests, and load time. These benchmarks will be essential for tracking progress.
Once you’ve established your baseline, move on to analyzing how resources load and behave on your site.
Checking Resource Loading and Network Behavior
Understanding how your site’s resources are delivered can uncover significant performance gains with minimal effort.
- Open the Network tab in Chrome DevTools and reload the page. Sort resources by size to identify optimization targets, such as large images, bulky JavaScript bundles, or oversized CSS files.
- Examine the waterfall chart to pinpoint resources that load late or take too long. Gaps between requests often signal render-blocking resources or inefficient loading sequences.
- Use Hoverify’s Assets module to organize and review resources. This tool helps you quickly spot assets that need compression or format changes.
- Utilize the Network and Coverage tabs in DevTools to identify oversized files and unused code that could be optimized or removed.
- Test your site under different network conditions by simulating slower speeds (e.g., Fast 3G, Slow 3G). This can reveal issues that may not appear on high-speed connections.
After reviewing how resources behave, move on to testing your site’s performance across a variety of devices and network setups.
Testing on Different Devices and Networks
Performance can vary significantly depending on the user’s device and connection, so testing in multiple scenarios is crucial.
- Use Hoverify’s Responsive Viewer to test your site across different device profiles. This tool shows how performance metrics shift on various screen sizes, highlighting areas where mobile devices may struggle with JavaScript-heavy content.
- Take advantage of synchronized scrolling and clicking in Hoverify’s viewer to test interactive elements across devices. For example, clicking a button on one device will replicate the action on others, helping you spot any lags or inconsistencies.
- Supplement these tests with Chrome DevTools’ Device Mode and CPU throttling to simulate older devices and ensure your site performs well across a range of hardware and software conditions.
Testing under diverse conditions ensures that your optimizations benefit all users, regardless of their device or network speed.
Reading Results and Making Improvements
Once you’ve analyzed performance metrics across devices and networks, the next step is to interpret the data and take meaningful action. Raw numbers don’t mean much unless they’re turned into improvements that enhance the user experience. Let’s dive into how to pinpoint issues, prioritize fixes, and ensure your optimizations stick.
Finding and Ranking Issues by Priority
Addressing every single issue isn’t practical, so focus on what matters most - problems that significantly impact user experience and business goals.
Start with Core Web Vitals, as they directly influence both Google rankings and user satisfaction. For example, if your Largest Contentful Paint (LCP) exceeds 2.5 seconds, prioritize optimizing images and improving server response times rather than making minor JavaScript tweaks. Similarly, if your Cumulative Layout Shift (CLS) score is above 0.1, it’s critical to resolve layout instability to prevent frustrating user interactions, like accidental clicks.
Think about the business impact of each issue. A slow checkout button likely has a much bigger effect on revenue than a delayed animation in the footer. Similarly, server response times over 600 milliseconds should take precedence over non-essential CSS that slows down loading.
File sizes can also guide your prioritization. For instance, images larger than 500KB or JavaScript bundles exceeding 1MB are clear opportunities for optimization. Use Hoverify’s Assets module to identify the largest resources and tackle them first - this often leads to quick wins.
Don’t overlook network behavior when ranking issues. Resources that block rendering or create long request chains, especially those affecting above-the-fold content, should be high on your to-do list.
Testing Fixes with Hoverify
Before rolling out changes to your live site, it’s essential to test optimizations to avoid introducing new problems. Hoverify’s tools make this process efficient and effective.
With Hoverify’s Inspector and visual editor, you can test fixes without touching your actual codebase. For example, you can tweak CSS properties to simplify layouts, resize images to test compression effects, or temporarily remove elements to see how their absence impacts performance. Hover over elements to understand how they interact with surrounding content, helping you prioritize changes.
The Responsive Viewer in Hoverify allows you to test fixes across multiple devices simultaneously. While a change might improve desktop performance, it could cause issues on mobile. The synchronized interaction feature ensures your optimizations work seamlessly across all screen sizes.
For more complex fixes, use Hoverify’s Debug module to inject custom CSS or JavaScript and simulate backend changes. Test these adjustments and measure their impact using browser developer tools. Once you’ve validated the improvements, you can export the code changes to guide your development team, ensuring the exact fixes are implemented.
Setting Up Ongoing Performance Monitoring
Performance optimization isn’t a one-and-done task - it requires consistent monitoring to maintain improvements and catch new issues early.
Schedule regular audits using the same tools and metrics from your initial analysis. For example, weekly Lighthouse audits can help you spot regressions before they become noticeable to users. Set up alerts for when Core Web Vitals exceed acceptable thresholds or when page load times surpass baseline measurements.
Hoverify’s Site Stack module is particularly useful for tracking changes to your site’s technology stack. New plugins, frameworks, or third-party scripts can often introduce performance issues that need to be addressed.
Establish performance budgets for key metrics like total page size, number of requests, and load times. For example, if your homepage exceeds 3MB or makes more than 50 requests, it’s time to investigate and optimize before the problem worsens.
Incorporate real user monitoring alongside synthetic testing. While tools like Lighthouse provide controlled testing environments, actual users experience a variety of network speeds, devices, and usage patterns. Real user data can reveal issues that synthetic tests might miss.
Finally, integrate performance checks into your development workflow. Run automated tests whenever new code is deployed, and use Hoverify’s tools to validate changes during development. This approach prevents performance regressions from reaching production. Set up performance dashboards to track key metrics over time, and review these trends monthly to identify gradual degradation or seasonal patterns that may require preemptive action.
Conclusion
Improving your site’s load times and user experience isn’t just a technical task - it’s a business necessity. Slow pages lose visitors, and every extra second of load time costs you some of them before your content ever appears.
Effective performance analysis rests on understanding Core Web Vitals and measuring them with tools like Lighthouse and WebPageTest. Hoverify simplifies the work with real-time testing across devices. Instead of trying to fix everything at once, focus on the high-priority problems: Core Web Vitals failures, large files, and render-blocking resources.
Making Performance Analysis a Routine
Regular performance audits are worth building into your schedule. Performance degrades over time as new plugins, updates, and content pile up, and much of your traffic arrives on mobile devices, where slowdowns hit hardest.
Scheduling weekly Lighthouse audits and setting performance budgets for metrics like page size and load times can help maintain your site’s speed and reliability. Hoverify makes this process straightforward, combining all the necessary tools into one browser extension. Instead of juggling multiple apps, you can inspect, test, and optimize within a single workflow. Features like the Capture module allow you to track improvements over time, while synchronized device testing ensures consistent performance across all platforms.
It’s also worth noting that Google factors page speed into its rankings, so performance affects your visibility in search as well as the experience once visitors arrive.
For the technology-identification side of this work (which frameworks, CMS, and hosting a site runs), see the companion guide on tech stack analysis. If you need a quick, client-ready snapshot rather than a deep dive, the 5-minute site audit covers the essentials in one pass.